All articles with 'Microsoft Excel Formulas' Tag
{ 76 Comments }
Automatic Rolling Months in Excel [Formulas]
Published on Apr 6, 2010 in Excel Howtos, Learn Excel
![Automatic Rolling Months in Excel [Formulas]](https://chandoo.org/img/f/dynamic-starting-month-demo.gif)
Often when we are making spreadsheets for forecasting or planning we would like to keep the starting month dynamic so that rest of the months in the plan can automatically rolled. Don’t understand? See this example: This type of setup is quite useful as it lets us change the starting month very easily. We can […]
Continue »{ 13 Comments }
There are Easter Eggs in this Post!!!
Published on Apr 2, 2010 in Learn Excel, personal

It is Easter Time again. Although I am not in Scandinavia (where Easter is a big thing) any more, we have a rather biggish family gathering here at PHD household during this weekend. We are also having anna prashanam for the little ones. It is the ceremony we do in India when kids eat rice […]
Continue »![How to Visualize Survey Results using Incell Panel Charts [case study]](https://chandoo.org/img/cb/survey-results-panel-chart-example.png)
A panel chart (often called as trellis display or small-multiples) shows data for multiple variables in an easy to digest format. It lets users compare in any way and draw conclusions with ease.
Today, I want to discuss how the principles of panel chart can be applied to visualize a complex set of survey results. For this we will use the recent survey conducted by Gartner on how various customers use BI (Business Intelligence) tools.
Continue »{ 10 Comments }
Making a Dynamic Dashboard in Excel [Part 2 of 4]
Published on Mar 30, 2010 in Charts and Graphs, Learn Excel
![Making a Dynamic Dashboard in Excel [Part 2 of 4]](https://chandoo.org/img/ed/excel-dynamic-dashboard-final-th.png)
In part 2 of Excel Dynamic Dashboard Tutorial, we will learn how to set up various dynamic charts that are part of the dashboard. We start with a simple dynamic pie chart that shows the sales distributions and then move on to sales trend line charts. These charts use various excel formulas to pull in the information based on user selection.
Continue »{ 9 Comments }
How to Check whether a Table is Filtered or not using Formulas
Published on Mar 29, 2010 in Excel Howtos, Learn Excel

Let us start the week with a simple formula (well, to be fair, let us start the week with a strong cup of coffee, then this formula).
Often when we have large data sets, we apply data filters to select and display only information we want to see.
Some of you know that whenever we apply filters on a dataset, we can look at status bar area to find out if any filter is applied on the current worksheet.
But, what if you need a way to show “filtering” status thru formulas? Like this…,
Continue »{ 62 Comments }
How to Convert Text to Dates [Data Cleanup]
Published on Mar 23, 2010 in Excel Howtos, Learn Excel
![How to Convert Text to Dates [Data Cleanup]](https://chandoo.org/img/f/excel-text-to-date-methods.png)
Sometimes when we import data from another source in to excel, the dates are not imported properly. This can be due to any number of reasons. In this post, we will learn some tricks and ideas you can use to quickly convert text to dates.
Continue »
In October 2008, I have started an ambitious series of posts on this blog called – Spreadcheats. These are little tricks, nuggets, tutorials on using Excel that would make anyone a spreadsheet guru.
The spreadcheats series has been wildly successful. I am compiling all this useful information and articles in to one big post so that anyone can follow the links and become good in Excel. Read on,
[Note: This is not for beginners. If you know what a formula is, you would enjoy this 31 articles]
Continue »{ 18 Comments }
Writing “Either Or” formula in Excel [Formula Howtos]
Published on Mar 2, 2010 in Excel Howtos, Learn Excel
We all know the AND, OR & NOT formulas in Excel using which you can perform simple logical operations And, Or & Negate. But what if you are the chief of HR at ACME Company, where they have a strange rule on extra allowance like this: Now, to calculate the dates in a month that […]
Continue »{ 30 Comments }
Annual Goals Tracker Sheet [awesome ways to use excel]
Published on Mar 1, 2010 in Charts and Graphs, excel apps
Marko, who is a long time PHD reader and an excel ninja sent this via email, I work at an insurance company in Slovenia. At the beginning of each year we have a conversation with our superiors to review our work in the past year and to set new goals (main activities) that we’re gonna […]
Continue »{ 17 Comments }
Find and Remove Blank Items from a Range of Cells [personal experience]
Published on Feb 23, 2010 in Excel Howtos
![Find and Remove Blank Items from a Range of Cells [personal experience]](https://chandoo.org/wp/wp-content/uploads/2010/02/remove-blank-cells-using-find-excel.png)
Most of you know that during day time I work as a business analyst. Today while preparing some test scenarios for our latest insurance application, I came across a weird problem. There are some steps in testing. For each test scenario, a combination of these steps is required. It is my responsibility to identify the […]
Continue »{ 6 Comments }
Excel School Last Call, Closing in Few Hours – Join Now!
Published on Feb 17, 2010 in Learn Excel, products
If excel school were to be a bar, this post is your last call. Come one, come all and order the course now. Click here to sign-up for excel school (on a lighter note, if excel school were to be a pie, we wouldn’t be having this conversation :P) How many students have joined the […]
Continue »{ 14 Comments }
Group Project Activities to Make Readable Gantt Charts
Published on Feb 11, 2010 in Charts and Graphs, Learn Excel
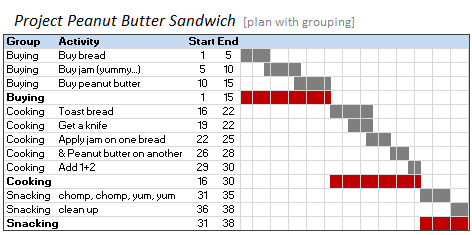
In Excel Gantt Charts part of our project management series, we have discussed about how using Conditional Formatting and Formulas we can make a gantt chart like this: But when you have large project plans, gantt charts like above can get pretty intense and hard to read. So a better approach is to group various […]
Continue »{ 75 Comments }
What is Excel SUBTOTAL formula and 5 reasons why you should use it
Published on Feb 9, 2010 in Learn Excel
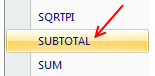
Today we will learn Excel SUBTOTAL formula and 5 beautiful reasons why you should give it a try.
SUBTOTAL formula is used to find out subtotal of a given range of cells. You give SUBTOTAL two things – (1) a range of data (2) type of subtotal. In return, SUBTOTAL will give you the subtotal for that data. Unlike SUM, AVERAGE, COUNT etc. which do one thing and only one thing, SUBTOTAL is versatile. You can use it to sum up, average, count a bunch of cells.
Continue »{ 13 Comments }
Data Validation using an Unsorted column with Duplicate Entries as a Source List
Published on Feb 2, 2010 in Learn Excel
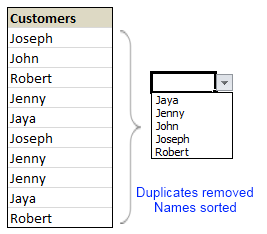
Here is a typical scenario: We want to allow only one of the pre-defined customer names in our spreadsheet. We have listed down all the customers in column B and want excel to check against this list and validate the data. But there are 3 problems. (1) Our list is not sorted alphabetically (2) It contains duplicates and (3) The list comes from external source, so we can not remove duplicates and sort the list every time.
Now how can we set up a simple data validation list that would not repeat customer names and shows them in sorted order like this.
Read the rest of this guest post by Hui to learn how to use data validation in creative new ways.
Continue »{ 31 Comments }
Flu Trends Chart in Excel [Yes, we can edition]
Published on Jan 22, 2010 in Charts and Graphs, Featured
![Flu Trends Chart in Excel [Yes, we can edition]](https://chandoo.org/img/p/flu-trends-chart-final-th.png)
Last week I have reviewed Google’s flu trends chart and told you that is it is very well made. Out of curiosity I made a similar chart in Excel. In this post, I am going to share the experience and results with you. Interested? Read on…
Continue »
