All articles with 'Microsoft Excel Formulas' Tag
![2012 Calendar – Excel Template [Downloads]](https://chandoo.org/img/c/free-excel-calendar-2012.png)
Here is a new year gift to all our readers – free 2012 Excel Calendar Template.
This calender has,
» One page full calendar with notes, in 4 different color schemes
» 1 Mini calendar
» Monthly calendar (prints to 12 pages)
» Works for any year, just change year in Full tab.
Go ahead and download the FREE 2012 Calendar and Enjoy.
Continue »
One of the most asked questions within the posts and Forums at Chandoo.org is, How Does Sumproduct work ?
Today in Formula Forensics we take at look at just that with a few worked examples.
Continue »
Zebra Stripes and Checker Boards
This week in Formula Forensics I’m taking a break from Array Formulas to have a look at some Zebra Stripes and Checker Boards.
No, I haven’t gone crazy, although some may argue that point.
More specifically were going to take a look at, Zebra Stripes and Checker-Board Conditional Formatting.
Continue »
.

.

.

.

.

.

.
This is the Forth post in Chandoo’s, Formula Forensics series.
Last week Luke showed us how to extract a sorted list according to a criteria from a larger list
and he analysed a formula to solve this problem
This week we look at Fred’s Problem…
How do I simplify a very long formula?
Continue »Christmas Gift Shopping List Template – Set budget, track your gifts using Excel

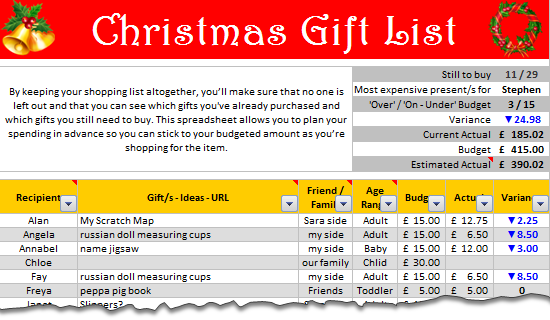
Last year, Steven shared a beautiful Christmas Gift List template with all of us. It is packed with lots of Excel goodness. Just a few days ago, he emailed me another copy of his file with some improvements. So if you are planning for Christmas shopping and want a handy tracker, you don’t want to miss this.
Continue »
Today we publish what is hopefully the First of many posts by guest author Luke M. it is also the Third post in the Formula Forensics series, which has now moved to a regular and new Thursday slot ?
Luke has taken up Hui’s and 3G’s challenge of explaining how the technique he regularly uses on the Chandoo.org Forums for extracting individual records out of a group.
Today Luke tells us how to extract a list of items from a larger list according to some criteria.
Continue »Using an Array Formula to Find and Count the Maximum Text Occurrences in a Range

Chandoo is off on Holidays and once again thrown me the keys to Chandoo.org.
So this week we’re going to:
- Pull apart an Array Formula and see what’s under the hood;
- Have a look at a technique for quickly developing Custom Number Formats &
- Look at how we can use HTML Codes in posts at Chandoo.org to spice up your questions and answers.
Today is Tarun’s Problem
“I have got multiple names in each row and would like to have what name is repeated maximum number of times and how many times?”
Today we pull apart an answer to this question and see how it works.
Continue »Compare 2 Lists Visually and Highlight Matches

Comparison is one of the most common things we do with Excel. Naturally, there are so many ways to compare 2 lists of data using Excel.
Today, I want to share an interesting comparison problem with you.
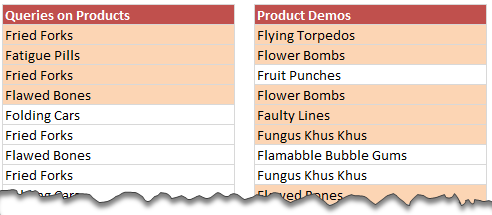
Lets say you run a small shop which sells some highly specialized products. Now, since your products require quite some training before customers can buy them, you keep track of all product queries and arrange demos.
After a hectic week, you are staring at 2 lists. One with product queries, another with product demos. And you want to know whether all the queries are answered with a demo or not.
Continue »
Sales Funnel or Sales Process refers to a systematic approach to selling a product or service. [more on sales process] Whether you run a small business or part of a large corporation, chances are, you heard about Sale Funnel. Understanding & analyzing your sales performance from a Funnel point of view is a great way […]
Continue »Sum of Values Between 2 Dates [Excel Formulas]
![Sum of Values Between 2 Dates [Excel Formulas]](https://chandoo.org/img/f/sum-of-values-between-2-dates.png)
Lets just say, you run a nice little orange shop called, “Joe’s Awesome Oranges“. And being an Excel buff, you record the daily sales in to a workbook, in this format. After recording the sales for a couple of months, you got a refreshing idea, why not analyze the sales between any given 2 dates? […]
Continue »Analyzing Performance of Stocks using Excel [Example]
![Analyzing Performance of Stocks using Excel [Example]](https://chandoo.org/wp/wp-content/uploads/2011/09/stock-analysis-in-excel.png)
Last week, we learned how to visualize Suicides vs. Murders data using Interactive charts in Excel. William, one of our readers, took this technique and applied it to Stocks. He emailed me because he has some formula issues with the stock data. Once I solved the problem, I asked him, “Can I share this with […]
Continue »Suicides & Murders by US States – An Interactive Excel Chart

Over at PTS Blog, my dear friend & charting guru, Jon Peltier has an interesting post on using dot plots to visualize Murders & Suicides data by US States.
Not that murders & suicides fascinate me, but I wanted to play with this data myself and see how we can visualize it. So I emailed Jon and asked him to share the raw data. Being a lovely chap Jon is, he immediately sent me the data. So here we are, playing with gory data on a Friday.
Suicides & Murders by US States – An Interactive Excel Chart
You can see a demo of the chart I came up with above. Read on to learn how this chart is constructed.
Continue »Simple KPI Dashboard using Excel

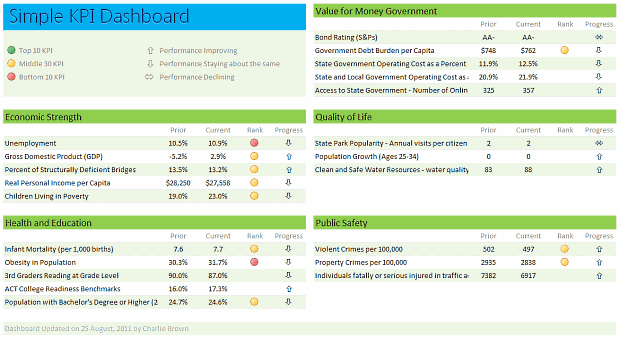
Any Tom, Dick and Sally can make things complex. It takes guts and clarity to simplify things. That is why I was pleasantly surprised to see this dashboard prepared by Michigan State. You can see it in the detailed article.
Linda, one of My Excel School students shared this dashboard link with me and asked if I can show how to construct something like this. Here is my version of the dashboard.
Read this post to learn how to construct a similar dashboard on your own. Also, you can download the excel workbook and play with it.
Continue »Split Text on New Line using Excel & VBA [Macros]
![Split Text on New Line using Excel & VBA [Macros]](https://chandoo.org/img/vba/split-text-on-new-line-macros-demo.gif)
Hafiz, One of our avid readers, writes in. My problem is when I convert data from text to column using dash “-“, conversion is easy. but when the gap provided in text is with “alt+enter”, I can’t convert the data.
Well, I tried to use text to columns feature (from Data ribbon) and it would not work.
Although you can use formulas to do the splitting, they might become tedious. So the next logical option is to use macros.
In this article, learn how to use VBA to split text on New Line characters
Continue »Join Excel Formula Crash Course & Master Excel Formulas
Who is this course for?
If you use MS Excel to do data analysis, reporting, day to day tracking or project management then this is the right course for you. If you struggle with formulas or not sure which formula to use for any given occasion, then this is the perfect course for you. We will be introducing more than 40 different formulas with 100s of examples in this course. As we will be using realistic data & examples, you can very quickly apply the same to your day to day work and do so much more with ease & confidence.
Click here to learn more & join this course.
Continue »


