All articles with 'Microsoft Excel Formulas' Tag
How many values are common in 2 lists? [homework]
![How many values are common in 2 lists? [homework]](https://img.chandoo.org/hw/formula-size-of-common-values-in-2-lists.png)
Here is a formula challenge for you. Lets say we have 2 lists of values in A1:A10 & B1:B10 Now, how do you find the number of common values in both lists? We just want the count, not list of common values it self. Go ahead and figure out the formula and post your answers […]
Continue »
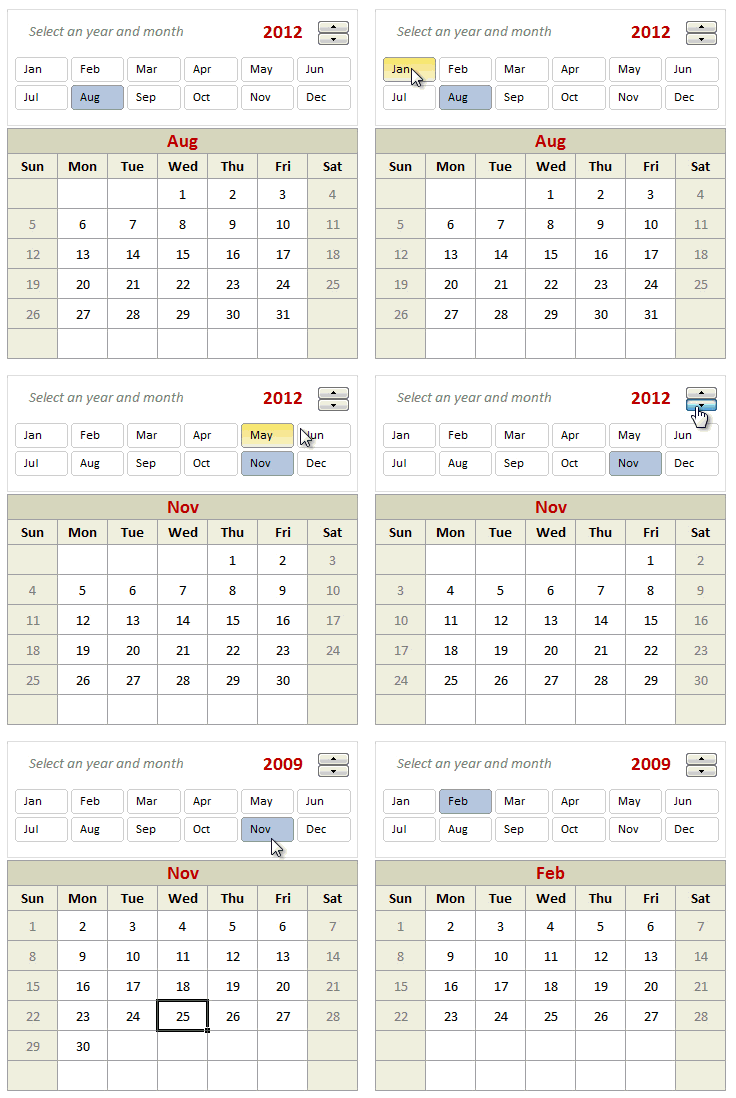
Can we make a calendar using Pivot Tables?!? Of course we can. Today let us learn a simple technique to create calendar style reports using Pivot tables. Thanks to Rob for inspiration Before making any progress, let me thank Rob from PowerPivotPro for the inspiration. Recently he wrote an article explaining how to use PowerPivot […]
Continue »Homework: Can you extract dates from text?

So who is up for a challenge? Can you use only formulas and extract dates buried inside text?
- Download this file.
- In column C, write a formula such that you can extract the date in column B
- If you succeed, post your solution here as a comment.
- If you fail, drink some coffee, start afresh.
![Making your dashboards interactive [Dashboard Essentials]](https://img.chandoo.org/vp/grammy-bump-chart-replication-in-excel-demo.gif)
Everyone likes to be in control. Even my 2 year old daughter jumps with joy when she lays her hands on TV remote. She pushes the buttons and assumes it is working. It is another story that we rarely watch TV at home.
By adding an element of control, we can make our dashboard reports fun. Interactive elements like form controls, slicers etc. invite users to play with your dashboard, get involved and understand data by asking questions. That is why I recommend making dashboards interactive.
Today lets understand how you can make dashboards interactive.
Continue »
Ladies & gentleman, put on your helmets. This is going to be mind-blowingly awesome.
See how many different ways are there to analyze Excel salary data. Look at these 66 fantastic, beautifully crafted dashboards and learn how to one up your dashboard awesomeness quotient.
Continue »Highlight Row & Column of Selected Cell using VBA

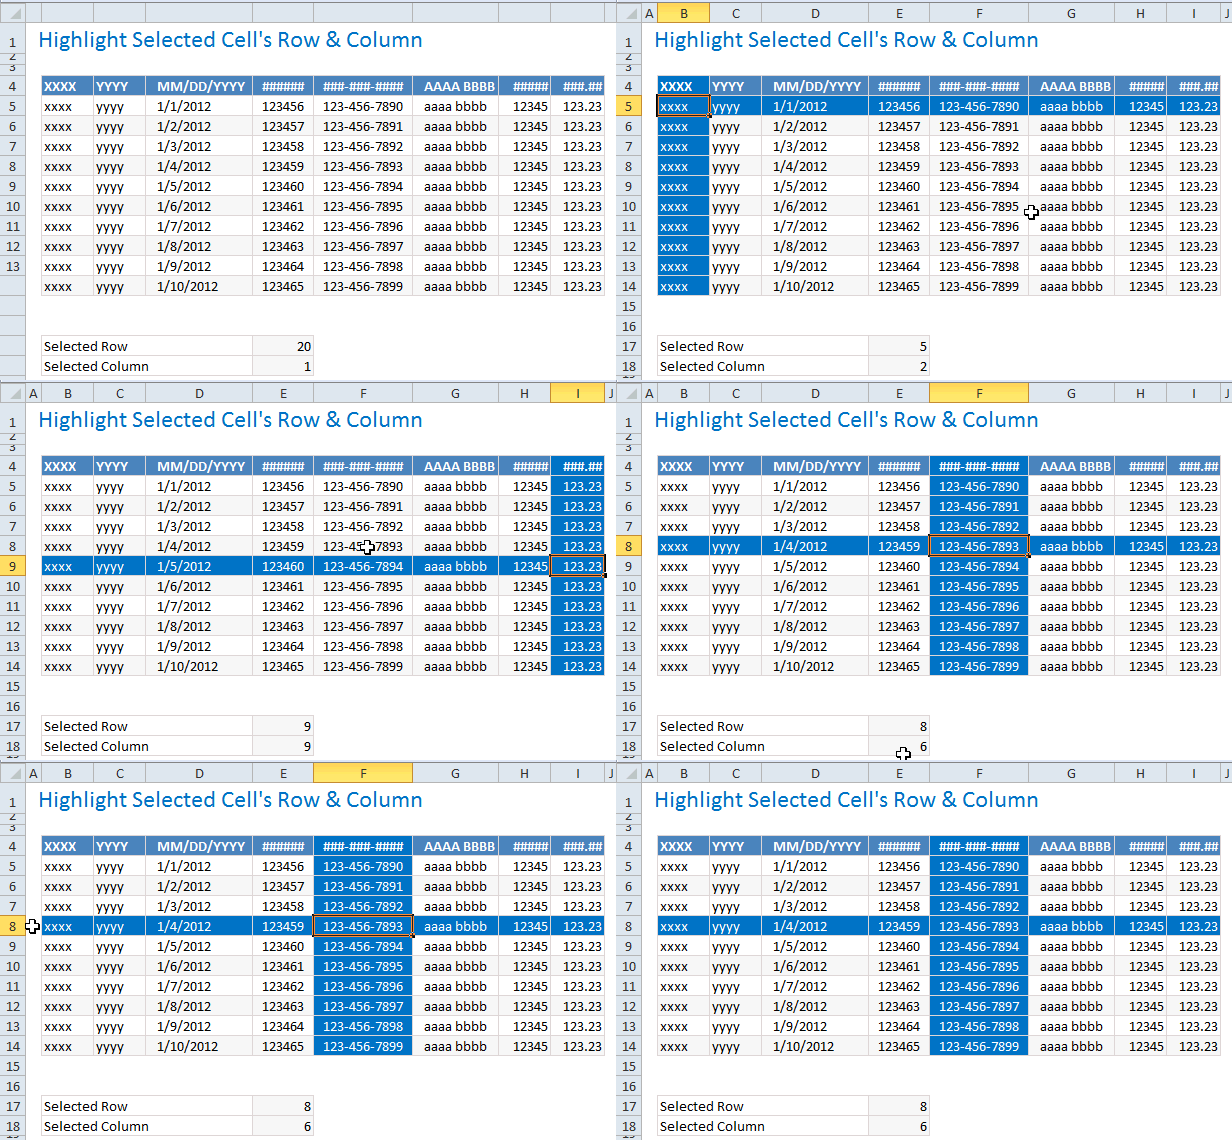
When looking at a big table of analysis (or data), it would make our life simpler if the selected cell’s column and row are highlighted, so that we can instantly compare and get a sense of things. Like above.
Who doesn’t like a little highlighting. So lets learn how to do highlighting today.
Continue »Find the last date of an activity

We know that using VLOOKUP, we can find a value corresponding to a given item. For example Sales of x. But what if you have multiple sales for each item and you want the last value?
Today lets understand how to find the last date of an activity, given data like above.
Like everything else in Excel, there are multiple ways to finding last date. If cats can use computers, they would hate Excel. You see, Excel is overflowing with unlimited ways to skin a cat.
Continue »Extracting numbers from text in excel [Case study]
![Extracting numbers from text in excel [Case study]](https://img.chandoo.org/f/extract-numbers-from-text-in-excel.png)
Often we deal with data where numbers are buried inside text and we need to extract them. Today morning I had such task. As you know, we recently ran a survey asking how much salary you make. We had 1800 responses to it so far. I took the data to Excel to analyze it. And surprise! the numbers are a mess. Here is a sample of the data.
Continue »
Today at Formula Forensics, we look at how to Count and Sum data using Criteria on Filtered data sets.
Continue »
How can we Add Up the Odd numbers between 1 and 100 ?
Continue »Highlight Employees by Performance Rating – Conditional Formatting Challenge

So who is up for an Excel challenge?
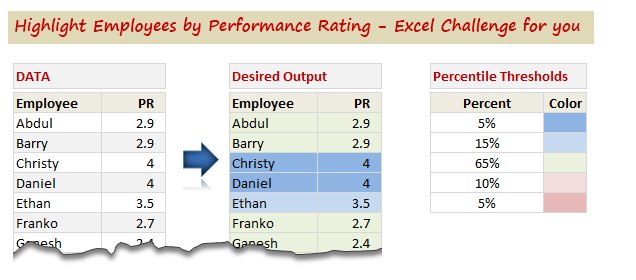
Shelly, who is an HR Manager sent this distress call last week,
“I have a group of employees- lets say 100 employees. Each employee has a performance rating attached to them. I want to divide the group by 5%, 15%, 65%, 10%, 5% based on their performance rating.”
And that is our challenge today. Read on & help Shelly.
Continue »
No, Not that Slash !
How do I find the 4th Slash in a text string?
Today at Formula Forensics we take a look at 4 different methods.
![Interactive Sales Chart using MS Excel [video]](https://img.chandoo.org/vp/interactive-sales-chart-quick-demo.gif)
Finally, I got some time to sit down and do what I love most – write a blog post to make you awesome in Excel. After a whirlwind trip to Sydney, I am back in India to spend few days with my kids & wife before rushing to Australia to run 2nd leg of my training programs (in Perth, Melbourne & Brisbane). I did 2 sessions in Sydney – one for KPMG and other for public and both went very well. We got lots of positive feedback and people really loved it. I am saving the details for another post, but today lets talk about Interactive Sales Chart using Excel.
Take a look at the Interactive Sales Chart
First, take a look at interactive sales chart. Today, you will learn how to build this using Excel.
Continue »
Bhavik’s has presented us with a neat formula to determine how many working days are in a month.
This functionality has a wide range of uses in accounting, payroll, staff scheduling, accommodation planning & reporting and general scheduling activities.
Today in Formula Forensics we pull Bhavik’s Formula apart and see what is going on inside and the offer some extensions to increase the functionality of his formula.
Continue »An IF Formula Challenge for you

If I were to hire an data analyst, I would simply ask them to write a complex IF formula in Excel. If they can write it, the interview progresses, else, they are out. In other words,
=IF(person_can_write_big_fat_IF_formula=TRUE, proceed_with_interview, say_thanks_and_call_next_person)
If you are able to write IF formulas for any situation, then you are bound to be awesome in Excel.
So, to test how well you know your IFs & Boolean functions, let me give you a small challenge.
Continue »

