All articles with 'Learn Excel' Tag
{ 15 Comments }
Are you ready for 2,000 miles, 15 days & 10 Excel tips road trip?
Published on Jun 24, 2013 in Charts and Graphs, personal

Finally my Excel classes in USA are over. It was a lot of fun traveling to new cities, teaching Excel & dashboards to enthusiastic crowds and making new friends. As if that is not fun enough, we (Jo, kids & I) are going on a 2,000 mile, 2 week road trip starting today.
Although I am enjoying all this, I also feel bad for not taking enough time to share new tricks, ideas & techniques with you here. So, I have a wacky, wild & awesome plan for you. Join us on our road trip.
That is right. You can join me on our road trip and see what I see, learn some pretty cool Excel tricks, all while sipping coffee and stretching legs in the comfort of your office cubicle.
Continue »As you may know, I am in USA and having a lot of fun exploring new areas, meeting people and conducting live classes. While all of this is enjoyable, I am also feeling guilty because I am unable to squeeze time to share Excel tips on the blog.
So to make it up to you, I recorded this short video (2 mins) with an Excel tip while bicycling in beautiful Euclid Creek Reservation in Cleveland on Friday. Watch it below.
Continue »
We all have some projects to manage every now and then and there are needs of various trackers that help us in gauging the progress of the same. One of the most important things are heat maps that quickly help us in visually displaying the names of the projects that need special attention and resolve issues that are impacting them.
Continue »{ 28 Comments }
How to find sum of top 3 values based on filtered criteria [video]
Published on May 17, 2013 in Excel Howtos
![How to find sum of top 3 values based on filtered criteria [video]](https://img.chandoo.org/f/sum-of-top-3-values-meeting-filtered-criteria-excel.png)
Lets say you are looking at some data as shown above and wondering what is the sum of budgets for top 3 projects in East region with Low priority. How would you do that with formulas?
Continue »{ 23 Comments }
How to transpose a values in a row to column using formulas… [Quick tip]
Published on May 14, 2013 in Excel Howtos
![How to transpose a values in a row to column using formulas… [Quick tip]](https://img.chandoo.org/q/transpose-columns-to-rows-using-formulas.png)
This is interesting, I am in Columbus to meet one of my college friends. I remember him as a very meticulous person from college days. So it is no surprise when he showed me his massively impressive finance tracker last night. He has been tracking expenses, income, credit card payments and gas (petrol) consumption since 2008. Very impressive indeed.
Then out of blue he said, he has a problem with his spreadsheet. In this own words,
When entering data for credit cards, I use one column per card. But in my report view, I want to show credit card details in rows. How do I do this?
Something like above…. Today, lets learn how to do this using Excel formulas.
Continue »{ 264 Comments }
I am meeting Mr. Excel aka Bill Jelen tomorrow. What do you want to ask him? (book giveaway too)
Published on May 9, 2013 in interviews
 One of the beautiful things about working on internet is you know so much about people even before you meet them first time. I think I first heard about Mr. Excel in 2006, when I started my career as business analyst. I landed on mrexcel.com while searching for something related to doing cluster analysis using Excel. In a way, mrexcel.com inspired me to share my thoughts and techniques on Chandoo.org.
So it wont be an understatement when I say, I feel like a kid in candy store knowing that Bill Jelen aka Mr. Excel is just a few miles away from where I live. Since Rob Collie and Bill are good friends, I asked Rob if we 3 can meet for dinner. And Bill said yes.
I am meeting Bill for dinner on Friday and Rob, Bill & I will be discussing spreadsheets, technology, share our experiences and bump ideas off each other.
Continue »{ 109 Comments }
How to create an Interactive Chart in Excel? [Tutorial]
Published on Apr 23, 2013 in Charts and Graphs, Excel Howtos
![How to create an Interactive Chart in Excel? [Tutorial]](https://cache2.chandoo.org/images/c/interactive-chart-in-excel-demo.gif)
Imagine you have a worksheet with lots of charts. And you want to make it look awesome & clean.
Solution?
Simple, create an interactive chart so that your users can pick one of many charts and see them.
Today let us understand how to create an interactive chart using Excel.
Continue »{ 6 Comments }
Chart for wall hygrometric physic (or how to create a chart with custom x axis intervals?)
Published on Apr 18, 2013 in Charts and Graphs
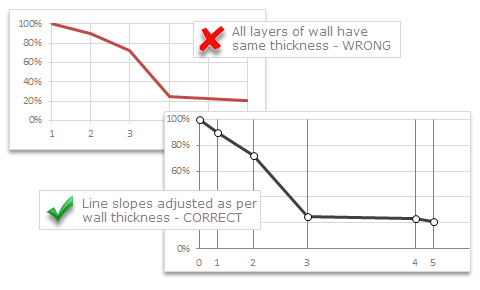
Livio, one of our readers from Italy sent me this interesting problem in email.
Continue »I would like to prepare an xy linear graphic as representation of the variation of temperature trough a wall between two different bulk temperature i.e. outside and inside a house. This graphic should show the temperature gradient trough the wall thickness. The wall is normally made by different construction materials (different layers, as bricks, insulation, …..) and so the temperature change but not as a straight line with only one slope, instead as few lines with different slopes (see below figure) Calculations are not difficult, and also prepare the graphic also not difficult.
But, I am looking a beautiful solution for x-axis. X-axis should be divided not with constant interval, instead with different length between each sub-division exactly as the different thickness of the wall. This is a correct graphic, because you can show the correct slope of each straight line though each layer of the wall.

Last week, we had a lovely poll on what are your favorite features of Excel? More than 120 people responded to it with various answers. So I did what any data analyst worth his salt would do,
I analyzed the data and here are the top 10 features in Excel according to you.
Read on to learn more.
Continue »{ 131 Comments }
What is your favorite feature of Excel? [poll]
Published on Apr 5, 2013 in Learn Excel
![What is your favorite feature of Excel? [poll]](https://img.chandoo.org/polls/what-is-your-favorite-excel-feature-poll.jpg)
Its Friday, time for another poll.
This weeks topic is inspired from a discussion Jordan started in our forums.
I will go first.
My favorite features are,
Conditional formatting: Quickly highlight something that is not alright (or meets conditions), see trends with data bars or heat maps.
Pivot tables: Turn data in to understandable information with just a few clicks. When combined with slicers & conditional formats, becomes very powerful.
Formulas: Ofcourse, with out formulas, Excel would be a glorified notepad!
What about you? What are your favorite features in Excel? Go ahead and share with us by posting a comment.
Continue »
Last week, we had our very first quiz – “How well do you know your LOOKUPs?”. I hope you have enjoyed it.
Today lets understand the answers & explanations for this quiz.
Continue »{ 48 Comments }
10 things that wowed me in Excel 2013
Published on Apr 3, 2013 in Charts and Graphs, Learn Excel

As you may new, the newest version of Excel is out for a while. I have been using it since last 6 months and enjoying it. Today, lets understand 10 things in 2013 that wowed me (and probably you too).
Continue »{ 143 Comments }
Unlock “Angy Formulas” – an Angry Birds like game hidden in Excel using this trick!!!
Published on Apr 1, 2013 in excel apps
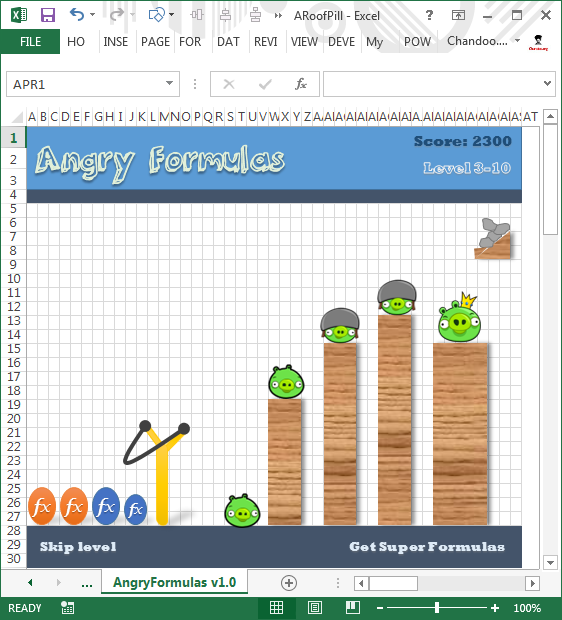
Sometimes you think you know something and then suddenly you are surprised. Yesterday was such a moment for me. I have been using Excel for almost a decade now. So naturally I assumed that I know it well. But then yesterday, while doing something I stumbled on a strange screen in Excel that looked like very popular Angry birds game. So I got searching. But there was no mention of it anywhere on net. Then I asked my friend Rollf ‘O’ Pai, who is in Micros0ft Execl team. First he denied such a thing. But we knew each other so well that he could never lie to me. So he confided. He told me what I had suspected for several years.
There is an Angry birds like video game buried in Excel!!! It was meant to be an Easter egg in Excel 2010 (and 2013), but due to backlash from senior management no one ever published the details about it.
So I asked him “How do I unlock it?”. Rollf ‘O’ Pai asked me to never reveal it to anyone and then told me the recipe.
Once I unlocked I could not believe how cool it is!
Read on to understand how to unlock this game.
Continue »{ 41 Comments }
There is an Easter egg in this chart!
Published on Mar 27, 2013 in Charts and Graphs

Do not worry, you are not time traveling or seeing things. Its just that, this year I have decided to publish our Easter Egg a few days early.
And oh, I have 3 reasons for it:
- 2 of my favorite festivals – Easter & Holi (a festival of colors, celebrated in India) are this week. Holi is today (Wednesday) & Easter on Sunday.
- My kids are super excited about Holi as this is the first time they will be playing it. So we have family time from today until Wednesday and I do not feel like writing a blog entry on Friday 🙂
- I like to have 3 reasons for everything.
Hence the Easter Egg is advanced a few days. But it is just as fun (or may be better) as previous Easter eggs.
Continue »![How well do you know your Lookups? [Quiz]](https://img.chandoo.org/hw/vloopkup-quiz.png)
So you think you know VLOOKUP formula? Well, test your knowledge.
Click here to take our first ever quiz – on Look up formulas.
Continue »
