All articles with 'Learn Excel' Tag

VLOOKUP is one of the most useful Excel functions. So much so that I even wrote a book about it. But it has one serious limitation.
It looks up the first occurrence and returns corresponding data.
What if you want to find the last value?
Say, for example, you are looking at a task assignment list and want to know what is the last task assigned to employee Emp13?
We want to extract the task “Make amazing workbook”. Of course our good old VLOOKUP stops once it finds Emp13 and returns the answer as “Create intuitive workbook”.
Continue »{ 4 Comments }
Make bar charts in original order of data for improved readability [charting tip]
Published on Aug 10, 2015 in Charts and Graphs
![Make bar charts in original order of data for improved readability [charting tip]](https://chandoo.org/wp/wp-content/uploads/2015/08/fixing-bar-chart-order-for-better-readability.png)
To make friends in a new town hit the bars – Old saying.
To make sense of a new data-set, make bar charts – New saying.
Bar charts (or column charts if you like your data straight up) are vital in data analysis. They are easy to make. But one problem. By default, a bar chart show the original data in reverse order.
See the above example.
Unfortunately, we humans read from top to bottom, not the other way around.
Continue »Conditional formatting is one of the most powerful & awesome features of Excel. It is very easy to setup. Naturally, people use it extensively. But the default conditional formatting rules can clutter your reports. Here is one tip that can declutter your reports.
Just show the formatting, not values.
See the above report.
Continue »{ 15 Comments }
Use shapes to enhance your Excel charts [tip]
Published on Aug 8, 2015 in Charts and Graphs
![Use shapes to enhance your Excel charts [tip]](https://chandoo.org/wp/wp-content/uploads/2015/08/use-shapes-to-enhance-your-charts.png)
Here is a simple way to enhance your Excel charts – use shapes & pictures in your charts.
We will learn how to create something like above.
Looks interesting? Read on…
Continue »{ 7 Comments }
Remove duplicate combinations in your data [quick tip]
Published on Aug 7, 2015 in Excel Howtos
![Remove duplicate combinations in your data [quick tip]](https://chandoo.org/wp/wp-content/uploads/2015/08/remove-duplicate-combinations-v2.gif)
By now, we know how to remove duplicates from data. You can use the Remove Duplicates button to do that.
But do you know that we can use remove duplicates button to get rid off duplicate combinations too?
Remove duplicate combinations – Tutorial
To remove duplicate combinations in your data, just follow below 4 steps:
- Select your data
- Click on Data > Remove Duplicates button
- Make sure all columns are checked
- Click ok and done!
See this demo:
Continue »{ 5 Comments }
CP041: 6 charts you’ll see in hell – v2.0
Published on Aug 6, 2015 in Chandoo.org Podcast Sessions, Charts and Graphs

Podcast: Play in new window | Download
Subscribe: Apple Podcasts | Spotify | RSS
In the 41st session of Chandoo.org podcast, Let’s take a trip to data hell and meet 6 ugly, clumsy, confusing charts. I am revisiting a classic Chandoo.org article – 6 Charts you will see in hell.
What is in this session?
In this podcast,
- Quick announcement about Awesome August
- 6 charts you should avoid
- 3D charts
- Pie / donut charts with too many slices
- Too much data
- Over formatting
- Complex charts
- Charts that don’t tell a story
- Conclusions
{ 13 Comments }
Save time with custom ribbons in Excel [tutorial]
Published on Aug 5, 2015 in Excel Howtos
![Save time with custom ribbons in Excel [tutorial]](https://chandoo.org/wp/wp-content/uploads/2015/08/create-custom-ribbon-tabs-excel.png)
A significant portion of our time in Excel is spent navigating between various ribbon tabs and clicking buttons. Wouldn’t it be better if you can combine all the frequently used features in to one ribbon? Something like above:
Read on to learn how to create, edit and share custom ribbons in Excel.
Continue »{ 35 Comments }
Calculate sum of top 10 values [formulas + homework]
Published on Aug 4, 2015 in Formula Challenges, Learn Excel
![Calculate sum of top 10 values [formulas + homework]](https://chandoo.org/wp/wp-content/uploads/2015/08/sum-of-top-10-values-excel.png)
Analyzing top n (or bottom m) items is an important part of any data analysis exercise. In this article, we are going to learn Excel formulas to help you with that.
Let’s say you are the lead analyst at a large retail chain in Ohio, USA. You are looking at the latest sales data for all the 300 stores. You want to calculate the total sales of top 10 stores. Read on to learn the techniques.
Continue »{ 6 Comments }
Shading an area chart with different colors for up & down movements [case study]
Published on Jul 29, 2015 in Charts and Graphs
![Shading an area chart with different colors for up & down movements [case study]](https://chandoo.org/wp/wp-content/uploads/2015/07/indian-stock-market-chart.png)
We all know that area charts are great for understanding how a list of values have changed over time. Today, let’s learn how to create an area chart that shows different colors for upward & downward movements.
The inspiration for this came from a recent chart published in Wall Street Journal about Chinese stock markets.
We will try to create a similar chart using Excel. We are going to create the above chart in Excel.
Looks interesting? Read on…
Continue »{ 14 Comments }
How to find out if a text contains question? [Excel formulas]
Published on Jul 17, 2015 in Excel Howtos, Learn Excel
![How to find out if a text contains question? [Excel formulas]](https://chandoo.org/wp/wp-content/uploads/2015/07/finding-if-cell-has-question-in-it.png)
On Wednesday (15th July), I ran my first ever webinar, on a topic called, “How to be a BETTER Analyst?” (here is the replay link, in case you missed it). It was a huge success. More than 1,100 people attend the live webinar and hundreds more watched the replay. As part of the webinar, we had interactive Q&A. Viewers posted their questions and I replied to as many of them as I can.
After the webinar, I wanted to make sure I covered all the questions. So I downloaded the chat history. There were more than 700 messages in it. And I am not in the mood to read line by line to find-out the questions. A good portion of chat messages were not questions but stuff like ‘hello everyone, I am from Idaho’, ‘Wow, Chandoo has beard!”, “Enjoying a beer in Belgium while watching webinar” etc. So I wanted a quick way to flag the messages as question or not.
Continue »{ 4 Comments }
CP038: Data to Ink Ratio – What is it, How to optimize it, Techniques & Discussion
Published on Jul 9, 2015 in Chandoo.org Podcast Sessions, Charts and Graphs

Podcast: Play in new window | Download
Subscribe: Apple Podcasts | Spotify | RSS
In the 38th session of Chandoo.org podcast, Let’s optimize data to ink ratio of your charts.
What is in this session?
In this podcast,
- Announcements
- What is Data to Ink Ratio?
- Obvious ways to optimize Data to Ink Ratio
- More ways to optimize Data to Ink ratio
- Highlighting what is important
- Conclusions
{ 15 Comments }
Are you an analyst? Use these 25 shortcuts & tricks to boost your productivity
Published on Jul 7, 2015 in Keyboard Shortcuts, Learn Excel

Analyst’s life is busy. We have to gather data, clean it up, analyze it, dig the stories buried in it, present them, convince our bosses about the truth, gather more evidence, run tests, simulations or scenarios, share more insights, grab a cup of coffee and start all over again with a different problem.
So today let me share with you 25 shortcuts, productivity hacks and tricks to help you be even more awesome.
Continue »{ 59 Comments }
What is the coolest thing you made with Excel? [weekend poll]
Published on Jul 3, 2015 in Learn Excel
It is almost weekend. I am sure most of you have plans (if you are USA, wish you happy 4th of July). As for me, I am going on a 80KM (50 mile) bicycle trip to a nearby lake to watch birds on Saturday morning. On Sunday, we (kids & I) are planning to make a scrapbook from our Australian experiences.
So let me keep this nice & simple.
What is the coolest thing you made with Excel?
Go ahead and share your answers in the comments area.
Continue »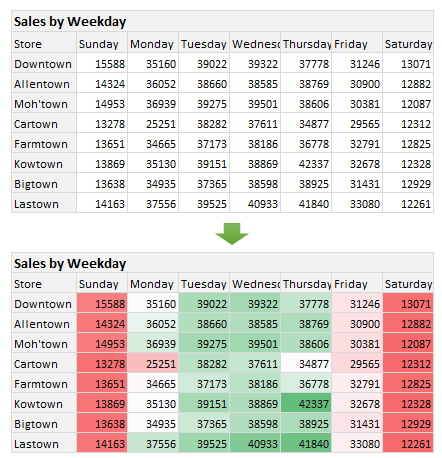
Here is a situation all too familiar.
You are looking at a spreadsheet full of data. You need to analyze and tell a story about it. You have little time. You don’t know where to start.
Today let me share 15 quick, simple & very powerful ways to analyze business data. Ready? Let’s get started.
Continue »{ 49 Comments }
Introduction to Slicers – What are they, how to use them, tips, advanced techniques & interactive reports using Excel Slicers
Published on Jun 24, 2015 in Learn Excel, Pivot Tables & Charts
Slicers are one of my favorite feature in Excel. And here is a quick demo to show why they are my favorite.
Slicers – what are they?
Slicers are visual filters. Using a slicer, you can filter your data (or pivot table, pivot chart) by clicking on the type of data you want.
For example, let’s say you are looking at sales by customer profession in a pivot report. And you want to see how the sales are for a particular region. There are 2 options for you do drill down to an individual region level.
- Add region as report filter and filter for the region you want.
- Add a slicer on region and click on the region you want.
With a report filter (or any other filter), you will have to click several times to pick one store. With slicers, it is a matter of simple click.
Read more to learn all about slicers
Continue »
