All articles with 'Excel Tips' Tag
VLOOKUP(), MATCH() and INDEX() – explained in plain English

VLOOKUP may not make you tall, rich and famous, but learning it can certainly give you wings. It makes you to connect two different tabular lists and saves a ton of time. In my opinion understanding VLOOKUP, INDEX and MATCH worksheet formulas can transform you from normal excel user to a data processing beast. Today, […]
Continue »How to use Date & Time values in Excel – 10 + 3 tips

Excel date time features are very handy and knowing how to use Excel date values can help you save a ton of time in your day to day spreadsheet chores. Let us prepare for your date with the sheet using these 10 handy tips.
Before jumping on to the tips, it helps to know how excel represents the date and time.
Microsoft Excel stores dates as sequential numbers … January 1, 1900 is serial number 1, and 28 July, 2021 is serial number 44405 because it is 44,405 days after January 1, 1900. Excel stores times as decimal fractions because time is considered a portion of a day.
Read on to learn more.
Continue »
Introducing a method of allowing data points to be interactively highlighted in Excel Scatter / X-Y Charts and Line Charts.
You will see a lot of these style charts in various places where you want to highlight various aspects of the chart to your audience. It is a great technique for complex scientific and engineering charts where you may have hundreds or thousands of points.
5 Areas where Mouse Kicks Keyboard’s Butt

We are a big advocate of keyboard shortcuts. I think learning a handful of keyboard shortcuts can improve your productivity tremendously, whether you are using excel or firefox.
But using only keyboard shortcuts is like using only right hand. So, we have compiled 5 incredible ways mouse can help you be productive while using MS Excel.
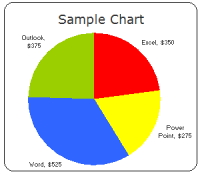
Continue »What is Your Opinion on Pie Charts?

Pie charts are one of the most used charts in the world. And for obvious reasons: they are simple to create and easy to understand. When it comes to pie chart, I have no clear opinion. Part of me says use them, the other says avoid them.
What is your opinion on Pie charts ?
Continue »Review of PTS Clustered Stack Chart

My Friend and long time Microsoft Excel MVP, Jon Peltier has released a wonderful little excel charting utility called Cluster Stack Chart Utility. Out of curiosity I have mailed Jon and asked him if he could send me a copy of it so that I can review the product and recommend it to PHD reader community. He is kind enough to mail the add-in to me and here goes my review of the tool.
Continue »
Learn how you can write your own twitter client using Excel. All it takes is excel, internet connection and 5 minutes of spare time.
Continue »Here is a list of 5 best posts from Jan 2009. Automatically Insert Time Stamps in Excel [12 comments], Excel Formula Wish list [25 comments], 6 ways to stack your column charts [17 comments], Hide worksheet tabs in excel [14 comments], 100 Excel Tips & Resources [10 comments]
Continue »Hurray, PHD blog crossed 2000 RSS Subscriber base. This is a very significant milestone for me.
To celebrate this occasion we have a mega post: 100 Excel & Charting Tips, Tricks and Resources for you.
Continue »Excel Links of the Week – Minor Changes to PHD edition

There are some minor changes to PHD sidebar layout and feed address. Also, in this week’s featured links learn how to Understand Stock Charts in Excel, Choose the Right Chart Using this Flow Chart, Quickly Create Named Ranges using F4 Key, Print Multiple Areas by Creating a Consolidation Sheet and Get a List of Filenames in a Directory to Excel using Browser
Continue »Do you know how to KISS, Wall Street Journal Does!

Do you know the “KISS” principle of chart design ?
Continue »[Reader Poll] Stacked, Seperated or Mirrored ?
![[Reader Poll] Stacked, Seperated or Mirrored ?](https://chandoo.org/img/a/bar-charts-ways-to-stack.gif)
Stacked bar charts are a popular way to depict 2 more series of related data, like sales of 2 products.But there are several ways to stack the bars in a bar chart. Here is a list of 6 ways to stack them
Continue »Visualizing Search Terms on Travel Sites – Excel Dashboard

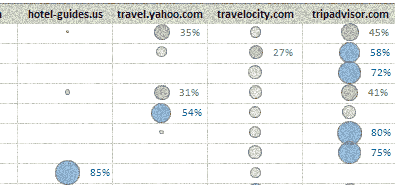
Microsoft excel bubble chart based Visualization to understand how various travel sites compete search terms
Continue »
9 charting tricks you can use to make your pie charts likable
Continue »What are the formulas you wish Excel had ?
Here is a list of formulas I wish MS Excel had. Alas, we need to build some work-arounds to solve them though.
Continue »

