All articles with 'downloads' Tag
Free Invoice Template using Excel – Download
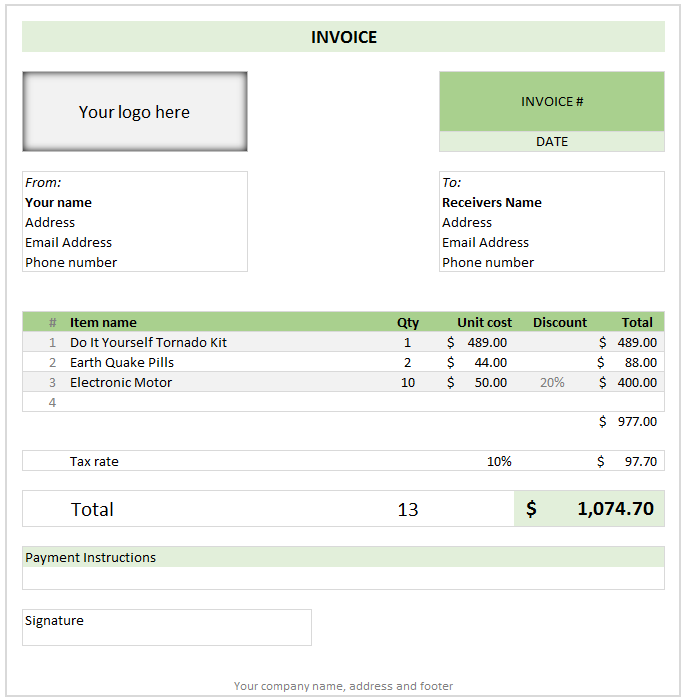
Anyone running a small business knows the oozing bits of joy when you hear a customer saying, “Can you send me an invoice?”
While creating an invoice is an easy task, if you want something that is professional looking, easy to manage and works well, then you are stuck.
That is where Excel really shines. By using an invoice template, you can quickly create and send invoices.
Today I want to share one such template with you all. Why? Because we are awesome like that.
Continue »CP002: VTALKUP – 5 Excel lookup functions demystified + 4 Resources for you

Podcast: Play in new window | Download
Subscribe: Apple Podcasts | Spotify | RSS
In the second session of Chandoo.org Podcast, We will be learning how to use 5 Excel lookup functions.
What is in this session?
In this session, we tackle one of the most important areas of Excel. The lookup functions.
You will learn,
- Why lookup functions are necessary
- 5 Important lookup functions in Excel – VLOOKUP, HLOOKUP, LOOKUP, MATCH & INDEX
- When & how to use each of these 5 functions?
- Extreme scenarios:
- What happens when the value you are looking up is not there?
- What if too many items match the lookup value?
- What if you have too many conditions in the lookup criteria?
- Using IFERROR function
- Re-cap of the new powers you acquired
- 4 Resources for you to learn lookup functions better
Can you extract first name & last name from email address? [Formula Challenge]
![Can you extract first name & last name from email address? [Formula Challenge]](https://img.chandoo.org/hw/formula-challenge-extract-first-last-name-from-email-address.png)
Today lets rescue John Doe from John_doe@email.com.
Extract first & last name from email address
Given an email address in the format
firstnameany_non-alphabet.characterslastname@email.com
You need to extract first name & last name using formulas.
Continue »Robust Dynamic (Cascading) Dropdowns Without VBA
Recently I posted about how you could construct dynamic (cascading) dropdowns that could easily handle multiple levels, like this: …and we saw that users could subsequently change upstream dropdowns in a way that would make downstream choices invalid, like this: In my previous post I used some VBA to clear out any ‘downstream’ choices if […]
Continue »I won’t eat donut with a thread inside, but lets make one anyway!

Today lets take a stroll outside what Excel can do and make something fancy, fun and may be useful.
Nowadays, many newspapers, websites and magazines are featuring info-graphics. An info-graphic is a collection of shiny, colorful & data-full charts (or often pieces of text.) In many of these info-graphics, you can see threaded-donut charts. Not sure what that is..? It is not same as the blasphemy of spoiling a soft, sweet, supple donut with a piece of string. No one should be excused for an offense like that.
What I am talking about is shown above
Continue »Quick and easy Gantt chart using Excel [templates]
![Quick and easy Gantt chart using Excel [templates]](https://img.chandoo.org/pm/quick-gantt-chart-template-excel.png)
Gantt charts are a very popular way to visually depict project plans. Today, let us learn how to use Excel to make quick & easy Project Plan Gantt Chart.
This is what we will be creating.
Continue »Dynamic dropdowns are a handy way to get your users to make choices based on what they’ve previously chosen, while steering them away from making invalid choices. Today we’re going to look at one that easily handles multiple levels, and we’ll take a look at what could go wrong. Let’s see one in action, shall […]
Continue »Combine pie and xy scatter charts – World Polls chart revisited
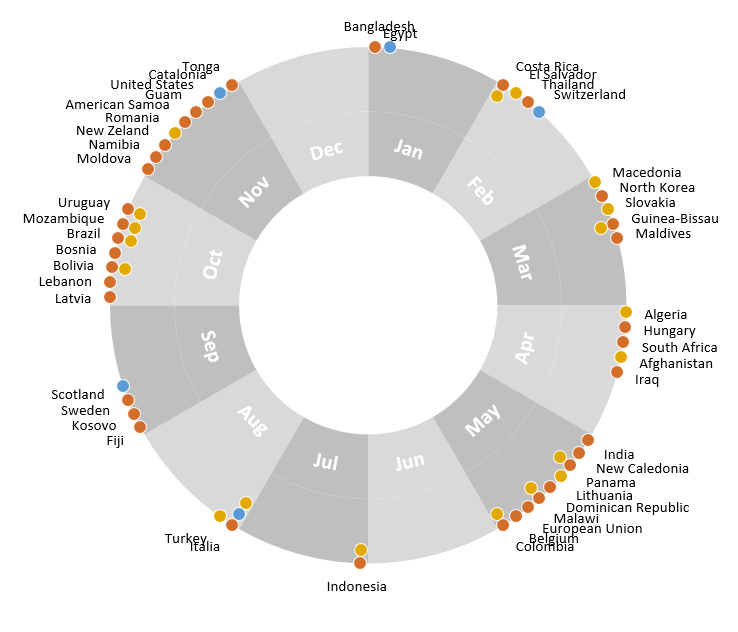
Few days ago, we learned how to create a pie+donut combination chart to visualize polls around the world in 2014. It generated quite a bit of interesting discussion (47 comments so far). One of the comments was from Roberto, who along with Kris & Gábor runs The FrankensTeam an online library of advanced Excel tricks, charts and other mind-boggling spreadsheet wizardry.
I really liked Roberto’s comments on the original post and a charting solution he presented. So I asked him if he can do a guest post explaining the technique to our audience. He obliged and here we go.
Over to FrankensTeam.
Continue »How to select a random sample from all your data [trick]
![How to select a random sample from all your data [trick]](https://img.chandoo.org/pivot/how-to-select-random-samples-from-data.png)
The other day, I got a text message (SMS) from one of our readers. It read,
So today, let us learn a very easy trick to select random sample from your data.
Continue »Did Jeff just chart?

How do you segment customers by revenue easily in Excel, so that you can see which customer groups to focus on. Find out, and download this handy template.
In this charting example, Jeff, our guest author, occasional charter and Excel wizard shows us how to segment customers based on revenue and depict the result using Excel charts.
Continue »42% of the world goes to polls around a pie chart – Like it or hate it?
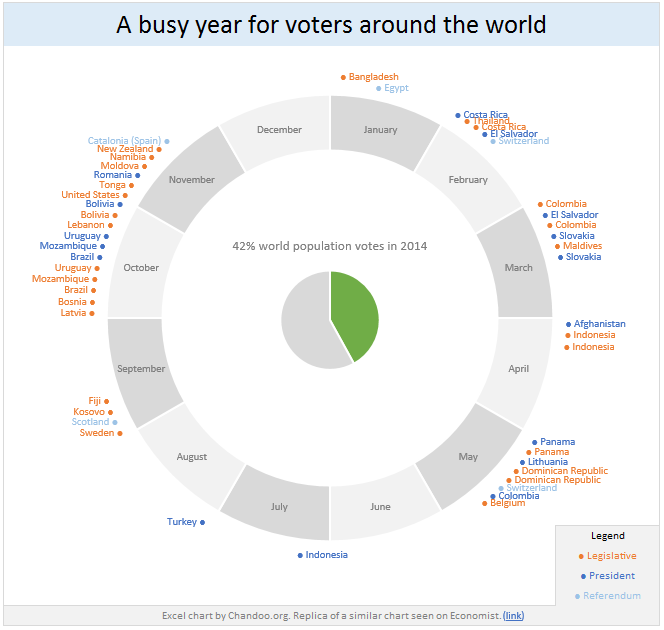
Today lets have a poll. Lets debate if this pie chart about world elections in 2014 is good or bad.
First lets take a look at the chart
This chart, published by The Economist talks about how 42% of the world population is going to vote this year. Take a look and read on to learn how you can re-create this in Excel.
Continue »Bar chart with lower & upper bounds [tutorial]
![Bar chart with lower & upper bounds [tutorial]](https://img.chandoo.org/c/bar-chart-with-lower-and-upper-bounds.png)
Bar & Column charts are very useful for comparison. Here is a little trick that can enhance them even more.
Lets say you are looking at sales of various products in a column chart. And you want to know how sales of a given product compare with a lower bound (last year sales) and an upper bound (competition benchmark). By adding these boundary markers, your chart instantly becomes even more meaningful.
Lets learn how to create a column chart with lower & upper bounds in this tutorial.
Continue »Free 2014 Calendar, daily planner templates [download]
![Free 2014 Calendar, daily planner templates [download]](https://chandoo.org/wp/wp-content/uploads/2014/01/free-calendar-and-daily-planner-template-2014.png)
Here is a New year gift to all our readers – free 2014 Excel Calendar & daily planner Template.
This calender has,
- One page full calendar with notes, in 4 different color schemes
- Daily event planner & tracker
- 1 Mini calendar
- Monthly calendar (prints to 12 pages)
- Works for any year, just change year in Full tab.
Merry Christmas & Happy New Year 2014 [Holiday Gift Inside]
![Merry Christmas & Happy New Year 2014 [Holiday Gift Inside]](https://img.chandoo.org/pers/christmas-new-year-card-2014-m.jpg)
Hello awesome readers of Chandoo.org,
I wish you a merry Christmas & very happy New Year 2014. May your holidays be filled with joy and warmth. And your new year with lots of hope, fun, strength and awesomeness.
I also want to tell you how thankful & fortunate I feel to have your support in this year. Your desire to learn Excel & become awesome at your work motivates me everyday to learn & share. 2013 is a memorable year in my life because of you. Thank you.
Continue »![Sporadic Totals in Excel [video]](https://img.chandoo.org/q/sporadic-totals-excel-example-data.png)
If this Excel problem is a Bollywood (Indian movie) plot, it would go like this:
Situation: Your boss gave you a worksheet. It has a lot of number chunks. And you need to calculate the sum of each chunk. Quickly!
Twist #1: The villain (your boss, who else) has abducted your spouse. For every extra hour you spend on the problem, your boss will make your spouse go thru one of the boring 97 slide strategy presentations. And his laptop is full of those strategy presentations.
Twist #2: The F1 key on your keyboard is missing.
Twist #3: The coffee machine in your floor is broken again.
Twist #4: And just when you are pressing CTRL+S, the movie steers in to an item song.
—-
Fortunately, no one abducted your spouse. And hopefully the coffee machine is working. But the Excel problem remains unsolved.
Continue »

