fbpx
Search
Close this search box.

Welcome to Chandoo.org.
My mission is to make you AWESOME in your work.

Hello, Namaste & Kia Ora. Welcome to Chandoo.org. 

My name is Chandoo. My mission is to make you awesome in Excel and Power BI.
I do this by sharing Excel & Power BI tutorials, examples, tips, videos and articles on this website. I live in Wellington, New Zealand with my beautiful wife Jo & our twins Nishanth & Nakshatra. Take a minute to browse various topics of the site to see how I can help you.

Thank you and welcome.

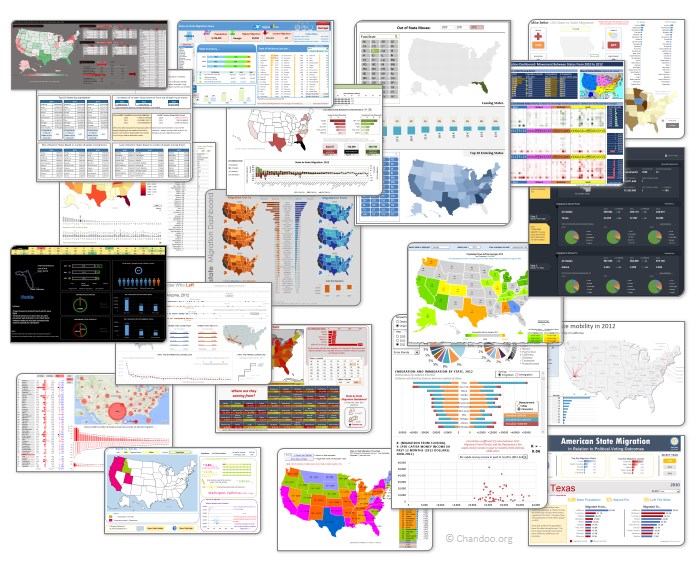
Excel Dashboards – 49 dashboards to visualize US State to State migration trends

Hello everyone. Stop reading further and go fetch your helmet. Because what lies ahead is mind-blowingly awesome.

About a month and half ago, we held our annual dashboard contest. This time the theme is to visualize state to state migration in USA. You can find the contest data-set & details here.

We received 49 outstanding entries for this. Most of the entries are truly inspiring. They are loaded with powerful analysis, stunning visualizations, amazing display of Excel skill and design finesse. It took me almost 2 weeks to process the results and present them here.

49 Dashboards to visualize State to State Migration - Chandoo.orgExcel Dashboard Examples - Visualizing state to state migration trends - Chandoo.org

Click on the image to see the entries.

Read This »

Matching transactions using pivot tables

Last week, we learned how to use formulas to reconcile (match) transactions in Excel. Today, lets take a look at even faster and simpler way to do this:

Using Pivot Tables


Here is a short video explaining the technique and why it works. See it below

Read This »

Matching transactions using formulas [Accounting]

Imagine you are the head of Accounts Receivable department at a large company. Drab, I know, But humor me and imagine.

Now, every month you get a transaction report.

And you want to know which numbers are matching up.

i.e, if your company gave Vendor-0002 $872.34 on 1st of April, 2014 and your received below payments from them subsequently,

  • $427.77 on 1st April
  • $152.88 on 2nd April
  • $291.69 on 2nd April

Then you consider the account matched since the total received is same as total payable.(427.77 + 152.88 + 291.69 = 872.34).

Read This »

CP010: Averages are Mean – 8 Techniques for making your analysis above average

This is a continuation of Session 9 – Averages are mean

In the earlier episode, we talked about AVERAGE and why it should be avoided. In this session, learn about 8 power analysis techniques that will lift your work above averages.

In this podcast, you will learn,

  • Re-cap – Why avoid averages
  • 8 Techniques for better analysis
  • #1: Start with AVERAGE
  • #2: Moving Averages
  • #3: Weighted Averages
  • #4: Visualize the data
  • Conclusions
Read This »

CP009: Averages are Mean – Know these things before you make any more AVERAGE()s

In the 9th session of Chandoo.org podcast, lets raise above AVERAGEs.

AVERAGEs are a very popular and universal way to summarize data. But do you know they are mean? Mean as in, AVERAGEs do not reveal much about your data or business. In episode 9 of Chandoo.org podcast, we tackle this problem and present solutions.

In this podcast, you will learn,

  • What is AVERAGE?
  • Pitfalls of averages
  • 5 statistic concepts you must understand
    • Standard Deviation
    • Median
    • Quartiles
    • Outliers
    • Distribution of data
  • What next?
Read This »

Implementing Modular Spreadsheet Development – a walkthrough

This article is written by Michael Hutchens from Best Practice Modelling.

In the first article on Modular Spreadsheet Development, we got a high level overview of Modular Spreadsheet Development principles. This article discusses the practical implementation of these principles in Excel.

From my experience using Modular Spreadsheet Development over the past decade, there are three increasingly-efficient methods of implementation in Microsoft Excel:

1. Manual implementation;
2. VBA automated implementation; and
3. Commercial add-in implementation.

This article provides a comprehensive overview of each of these methods and a summary of their advantages and disadvantages.

Read This »

Latest Video

Play Video

for more videos…

Learn Excel Step by Step

Everything from Power Query to Dashboards, Shortcuts to Formulas, Pivots to Charts in one course.

Topics

Power BI

Excel & Power BI for you

What people say about Chandoo.org

A relative told me about your website since I need help creating pivot tables, I learned how to do it in a matter of minutes thanks to your tutorial. Where have you been all of my excel troubled life, I look forward to viewing your videos on youtube as well as on your site. You are going to make me EXCELLENT at Excel!
Soulful Sista
Excel Sister
Hi Chandoo, I just want to say I really appreciate your Excel tutorials and all your hard work that it took to compile the huge library of content. Your site has helped me gain a better understanding of Excel which has helped me in my job. You are helping the world!
Felix H
Accountant
Throughout my life as an administrative assistant; your site has been invaluable to me. And now that I’m a recruiter; it’s still an amazing resource for when I need to teach someone something quickly. You are a friggin’ Rock Star!!! Thank you for everything you do.
Jason S
Recruiter

Courses for you

Excel School

Learn how to work with data, make calculations, pivots, create amazing charts and powerful dashboards from scratch using Excel School + Dashboards program. Suitable for analysts, managers or professionals who need to use Excel often.

VBA Classes

Use VBA to automate your tasks and build powerful spreadsheet based apps. In this course, learn all about how to program with VBA, how to use the language and object model to your advantage. Suitable for people who build a lot of things with Excel.

Power BI

Power BI, the newest technology from Microsoft is a game changer. You can build rich, interactive and informative displays for your audience using Power BI. In this course, learn all about Power BI, Power Query and Power Pivot and how to combine them to achieve awesome results.

=XLOOKUP(chandoo, on_social_media)