All articles in 'Power BI' Category
How to create SVG DAX Measures in Power BI (Easy, step-by-step Tutorial with Sample File)

SVG (Scalable Vector Graphics) is a great way to add a bit of flavor and pizzazz to your boring Power BI reports. I have been using them for a while and really love how easy and fun they are to work with. So today, let me share the technique and provide sample measure code that […]
Continue »How to Create a Power BI Dashboard for Insurance Analytics (With Examples)

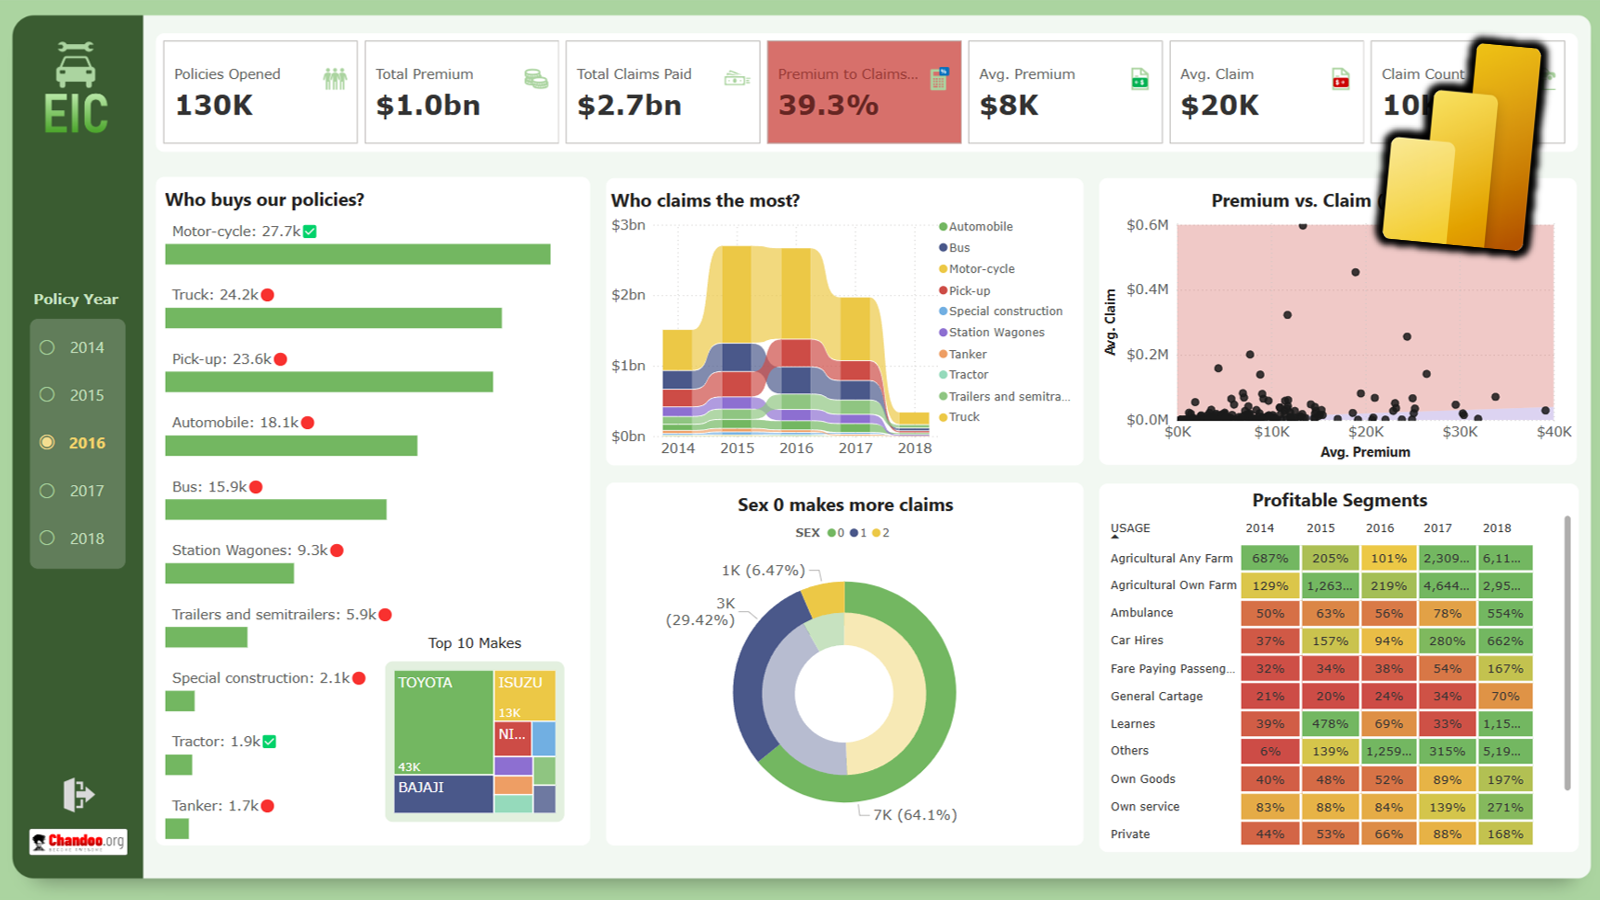
1. Introduction Insurance is a perfect industry for data analysis. There is plenty of data – right from lead generation to to underwriting to policy issuance to administration to claims processing. With a careful and well thought data strategy insurance companies can become profitable. Power BI makes data analysis in insurance space a breeze. Whether […]
Continue »New vs. Returning Customers Analysis with DAX [Easy Formulas]
![New vs. Returning Customers Analysis with DAX [Easy Formulas]](https://chandoo.org/wp/wp-content/uploads/2025/03/SNAG-0107.png)
DAX offers powerful way to analyze “new” vs. “returning” customers. In this article learn easy and simple DAX measure patterns to count number of new customers and number of returning customers from your data. What is a Returning Customer? A returning customer is someone who comes back to our business and does another transaction. For […]
Continue »Sales Analysis Dashboards with Power BI – 30+ Alternatives

Do you need inspiration for your upcoming Power BI sales dashboard? Well, I got you covered. In this page, let me present 33 alternatives for Sales Analytics Dashboards with Power BI.
Continue »Announcing Power BI Dashboard Contest (win $500 prizes!)

Hey there, I have a SUPER exciting announcement! April is about to get a whole lot sweeter with our Power BI Dashboard Contest! Your mission, should you choose to accept it: Craft the most EPIC dashboard for the Awesome Chocolates CEO with sales & financial insights! Winners stand a chance to score up to $500 in Amazon Gift Cards, plus some serious bragging rights!
Continue »Top 10 Power BI Interview Questions & Answers

I recently interviewed people for Power BI analyst roles and here are my top 10 favorite questions to assess the skills (with answer cues).
Continue »CP03: The Ugly Truth About Power BI (actually, 4 of them)

Podcast: Play in new window | Download
Subscribe: Apple Podcasts | Spotify | RSS
Power BI is one of the most prominent data analytics technology out there.
Power BI is also one of the most marketed and hyped technology out there.
Unfortunately, both of these statements are true.
In a world where data is the buzz word, Power BI (or other similar platforms like Tableau) appeal to CXOs as panacea for all their data troubles.
But, just as any technology, Power BI too has it’s own shortcomings. So in this episode of my podcast, let’s uncover 4 ugly truths of Power BI.
Continue »How to “auto” generate calendar tables with Power Query – The best method

Calendar (or date) table is crucial for performing date intelligence calculations in Power BI.
Normally, you would find a reasonable calendar table in most data models. But occasionally I come across models where there is no calendar table.
So I present to you, the ultimate & best way to generate calendar table using Power Query.
Continue »When & how to use the 30+ chart types in Power BI?

Power BI has a LOT of chart types. So, when & how to use these charts in data analysis situations? In this article, let me share my top tips for picking and using the right chart type for your needs.
Continue »How to create interactive tooltips in Power BI (step by step)

One of the easiest ways to impress your audience with Power BI is a tooltip. This simple idea can provide incredible value to the report readers and elevate your work to next level. In this easy tutorial, learn how to set up and work with tooltips in Power BI.
Continue »Getting Started with Power BI – Sales Dashboard in one hour

Learn Power BI and create your own Sales Dashboard with this FREE Masterclass. Details inside.
Continue »Introducing Power BI Play Date – Online class to master Power BI (oh yeah, Power Query & Power Pivot too)

Hello friends,
It’s here. Power BI Play Date – our online training program is now ready for your consideration. Please take a few minutes to read this to know all about the program. If you are ready to join, click here.
Check out below slideshow to see some of the reports you can create in our course. It is #AWESOME.
Continue »How to make a variance chart in Power BI? [Easy & Clean]
![How to make a variance chart in Power BI? [Easy & Clean]](https://chandoo.org/wp/wp-content/uploads/2020/06/variance-chart-in-Power-BI-1.png)
Power BI is great for visualizing and interacting with your data. In this article, let me share a technique for creating variance chart in Power BI. Variance charts are perfect for visualizing performance by comparing Plan vs. Actual or Budget vs. Actual data.
Continue »Introduction to Power BI – What is it, how to get it, how to create reports with Power BI and how to publish them?

Power BI is a data analytics & visualization software. It is one of the most popular and powerful way to work with complex business data. In this page, you will find a comprehensive guide to start your Power BI journey.
Continue »
Waffles are yummy, Power BI is awesome. The combination is going to send your taste-buds on a cruise. Learn how to make a yummy waffle chart in Power BI.
Continue »

