Archive for October, 2009
Sweet Sweet Testimonial from a Sweet Sweet Lady
They say on once in a while even monkey’s thump their chests and show off. As a proud evolver, I must take their lead and thump my chest. I want to share a sweet testimonial I received from Marcea, one of our newest readers. Read more to see the testimonial.
Continue »
Yesterday I read about interaction plots on junk charts where he points out the merits of an interaction plot. Interaction plots show interaction effects between 2 factors. For eg. you can show how your product sales have changed between year 1 and year 2 using an interaction plot like the one shown aside.
Continue »Copy Data Validations from one cell to another [quick tip]
![Copy Data Validations from one cell to another [quick tip]](https://chandoo.org/img/i/copy-data-validations.png)
If only there is paste special for everything in life, things would be much more smoother and fun. Alas, the paste special is limited only to excel.
Here is a handy trick you can use to quickly scale up data validations set up in one cell to say a range of cells.
Just copy the cell by pressing CTRL+C and then go to the target cell(s) and press ALT+ESN. And your data validations are pasted in the new cells. That is all. Quick and Easy.
Continue »Project Dashboard + Tweetboard = pure awesomeness!!!

Check out an implementation of project dashboard along with tweetboard by our reader Fernando. He says, it “turned out to be a great success”. I am so happy for him.
Btw, the post includes a link to download the workbook so that you can see the dashboard and tweetboard in action.
Continue »Prevent Duplicate Data Entry using Cell Validations

We all know that data validation is a very useful feature in Excel. You can use data validation to create a drop-down list in a cell and limit the values user can enter. But, do you know that you can use data validation in a multitude of ways to prevent users from entering wrong data?
Here is a practical application: Prevent users from entering duplicate values in a range of cells.
For eg. you are making an invoice. Wouldn’t it be cool if Excel prompted you when you enter a duplicate line item so that increase the item quantity instead of repeating it.
Continue »Solve Sudoku Puzzles using Excel [because it is weekend]
![Solve Sudoku Puzzles using Excel [because it is weekend]](https://chandoo.org/img/i/sudoku-solver-using-excel.png)
Sanjay, my colleague is an avid programmer and excel enthusiast. In his spare time he wrote a small VBA macro to solve Sudoku. Sudoku is a very famous number based puzzle with a 9×9 grid of cells. Each of the 9 rows, columns and 3×3 blocks should be filled in such a way that they have all the numbers from 1 to 9. Sudoku is a very effective way to keep your brain cells ticking. I am a huge sudoku fan and I solve sudoku whenever I have few minutes to kill. So naturally I jumped with joy when I saw Sanjay’s excel macro for solving sudoku. He is kind enough to let me share this with all of you.
Continue »Debra at Contextures is having an Excel Fall Giveaway and you could get a free copy of Project Management Bundle by sharing your excel nightmare or excel costume idea. It is that simple. Go here. PS: the flight to Copenhagen was good, I am safe in Scandinavia, regular broadcasting should resume shortly.
Continue »< drum roll > Welcome Nakshatra and Nishanth to their first public appearance.Nakshatra is the girl and Nishanth is the boy (for the curious, Nakshatra means star and Nishanth means moon) Here is a fun question: Can you guess which one is Nishanth and which one is Nakshatra? On more family affairs, today I am […]
Continue »How to get Excel 2003 Toolbars in Excel 2007 [productivity hack]
![How to get Excel 2003 Toolbars in Excel 2007 [productivity hack]](https://chandoo.org/img/p/customize-quick-access-toolbar-th.png)
In our recent poll, I have asked you to tell me which buttons you have on the quick access toolbar?
Finnur, one of our readers has configured the Excel 2007 quick access toolbar to make it look like Excel 2003 toolbar.
I think this is a very cool way to max up your productivity, it takes 5 minutes to make your quick access bar look like Excel 2003 toolbar and you could save countless hours of “searching-for-that-command-in-ribbon” time.
Continue »Making a chart with dynamic range of values

We all know that to make a chart we must specify a range of values as input.
But what if our range is dynamic and keeps on growing or shrinking. You cant edit the chart input data ranges every time you add a row. Wouldn’t it be cool if the ranges were dynamic and charts get updated automatically when you add (or remove) rows?
Well, you can do it very easily using excel formulas and named ranges. It costs just $1 per each change. 😉
Ofcourse not, there are 2 ways to do this. One is to use Excel Tables and another is to use OFFSET formula.
Continue »
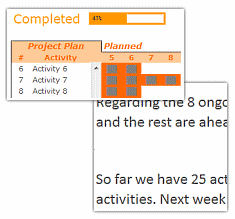
I have a super exciting news for all our members. During the last several weeks, I have been working on making 24 strikingly remarkable and easy to use excel templates for better project management. Finally the bundle is ready. You can get a copy of the bundle starting today.
Continue »Baby Feeding Chart using Excel

While feeding the babies last night, I had this idea. Why not make an excel sheet where you can keep track of the baby’s feeding and sleeping activities on day to day basis. It would probably help you understand your baby’s needs better and may be give you some insights.
Continue »Visualization Lessons from Eiffel Tower [Chartbusters in Paris]
![Visualization Lessons from Eiffel Tower [Chartbusters in Paris]](https://chandoo.org/img/cb/eiffel-tower-visualization-lessons.png)
Ever since I was a child, I was fascinated by Paris (and Eiffel Tower). Recently, I had opportunity to visit Paris, albeit for just a few hours (I had a 12 hour lay-over in Paris between flights). I went to see the Eiffel Tower and it looked just as beautiful and majestic as it did in my imaginations.
During my visit to Eiffel tower, I took the stairs to 2nd floor and along the way they have a handful of visualizations explaining the tower. I found them quite interesting and well made. Here, I have listed down 4 simple, yet very effective visualization lessons for all of us.
Continue »Another Reason why Tables are so awesome [quick tip]
![Another Reason why Tables are so awesome [quick tip]](https://chandoo.org/img/l/excel-table-scroll-feature.png)
Ever since I have learned the tables feature in Excel 2007, I have fallen in love with that. They are so awesome and so user friendly.
Here is a simple, yet very effective feature of Excel Tables that will show table header row even when you scroll down. The header row is shown in the place of column headings (the place where you see A,B,C,D etc.).
Continue »![Project Management Dashboard / Project Status Report using Excel [Part 6 of 6]](https://chandoo.org/img/pm/project-status-dashboard-th.png)
Project management dashboards, project status reports help stakeholders, project sponsors and team-members can understand project status very quickly. In the last installment of project management using excel, learn how to make project management dashboard using excel in this tutorial. Also download the excel project status dashboard template.
Continue »

