All articles with 'analysis' Tag
{ 1 Comment }
CP042: Financial Analysis & Modeling concepts – 101
Published on Aug 13, 2015 in Chandoo.org Podcast Sessions, Financial Modeling

Podcast: Play in new window | Download
Subscribe: Apple Podcasts | Spotify | RSS
In the 42nd session of Chandoo.org podcast, Let’s talk about money. We are going to learn about various concepts that are vital for doing financial analysis and building models.
What is in this session?
In this podcast,
- Quick announcement about Awesome August
- 5 key finance concepts
- Time value of money
- Compound interest
- Risk free rate of return
- Net Present Value – NPV
- Internal Rate of Return – IRR
- Case study – Uber vs. Your car
- Conclusions
{ 44 Comments }
ABC Inventory Analysis using Excel
Published on Oct 1, 2014 in Charts and Graphs, Learn Excel
ABC analysis is a popular technique to understand and categorize inventories. Imagine you are handling inventory at a plant that manufactures high-end super expensive cars. Each car requires several parts (4,693 to be exact) to assemble. Some of these parts are very costly (say few thousand dollars per part), while others are cheap (50 cents per part). So how do you make sure that your inventory tracking efforts are optimized so that you waste less time on 50 cent parts & spend more time on costly ones?
This is where ABC analysis helps.
We group the parts in to 3 classes.
- Class A: High cost items. Very tight control & tracking.
- Class B: Medium cost items. Tight control & moderate tracking.
- Class C: Low cost items. No or little control & tracking.
Given a list of items (part numbers, unit costs & number of units needed for assembly), how do we automatically figure which class each item belongs to?
And how do we generate above ABC analysis chart from it?
Continue »{ 4 Comments }
CP013: Is this a FIFA worldcup of late goals, lets ask Excel [How to analyze data to answer questions like these…]
Published on Jul 3, 2014 in Chandoo.org Podcast Sessions, Charts and Graphs
![CP013: Is this a FIFA worldcup of late goals, lets ask Excel [How to analyze data to answer questions like these…]](https://img.chandoo.org/podcast/session-013.png)
Podcast: Play in new window | Download
Subscribe: Apple Podcasts | Spotify | RSS
In the 13th session of Chandoo.org podcast, lets turn our attention to on-going FIFA worldcup and ask an important question.
What is in this session?
A week ago, we discussed “Has it been a late goal FIFA worldcup?” and used various charts & analysis techniques to answer the question. In podcast, lets tackle the same problem, understand various approaches to answer questions like these & shares some lessons for all the analysts.
{ 31 Comments }
Filter values where Fruit=Banana OR Sales>70. In Other Words, How to use Advanced Filters?
Published on Oct 10, 2011 in Excel Howtos, Learn Excel
Filtering is a simple yet powerful way to analyze data. When you apply filters to any list of values, Excel gives you some really useful pre-defined filters so that you can analyze the data in a variety of ways. So, assuming you have data like this: We all know how to filter data for Bananas. […]
Continue »{ 115 Comments }
Sales Dashboards – Visualizing Sales Data – 32 Dashboard Examples & Implementations
Published on Jan 4, 2010 in Charts and Graphs, Featured

Sales reports and dashboards are very common in any company. There are several ways in which you can visualize sales data to understand the trends and sales performance. So in November, I have asked you to visualize sales data using sample data. The visualization challenge #2, sponsored by Zoho Reports generated a huge buzz around the community and fetched 32 incredible entries. The response was so overwhelming that it took me almost 24 hours to write this post. Thanks everyone for participating and making this a huge learning experience for everyone. Personally I have learned several useful dashboard and charting tricks. I will be sharing some of these lessons with all of you in the coming weeks.
Continue »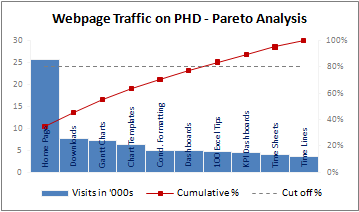
A Pareto chart or pareto graph displays the importance of various factors in decreasing order in columns along with cumulative importance in a line. Pareto charts are often used in quality control to display most common reasons for failure, customer complaints or product defects. The pareto chart is a great way to do the pareto analysis. Today, we will learn how to use excel to make a pareto chart.
Continue »{ 10 Comments }
Making Pie-charts look Sexy – The CNN’s tax burden analysis chart
Published on Oct 29, 2008 in Analytics, Charts and Graphs

There is always a debate about how good or evil pie charts are. While visualization purists believe pie charts should be avoided at all costs, newbies find creating and using pies very easy and often over do it. I have blogged few techniques involving pie chart visualizations like in-cell pie charts, speedometer charts, donut clocks […]
Continue »How can you ensure that your blog post, term report or business case is readable without spending a lot of time getting beta reviews from others? Thanks to google docs, you can do that with one click. Just upload your word document / txt file to google docs. Once inside, goto menu > tools > […]
Continue »Here is a question for all you game theory enthusiasts Imagine you are planning to rent an apartment from PACiM (Popular Apartment Complex in Madras). Since the PACiM lease office is nice they give reference commission to any tenant who brings a new person for renting a house there. The good thing is you have […]
Continue »The combination sounds as inseparable as ctrl+c and ctrl+v. But when it comes to making a career choice there is a fair bit of confusion as to what an MBA will do in an IT company, especially in the first few years. Marketing companies have it easy, in the first 18 months, you would be […]
Continue »{ 5 Comments }
Howto: Excel Based Mutual Fund Portfolio Tracker
Published on Nov 13, 2006 in Learn Excel, personal finance
Instead of searching for the NAVs of all my funds at MyIRIS or MutualFundsIndia, I have developed a small excel sheet which will fetch the values for me and displays the current portfolio value at the click of a button. Here I am trying to share the “HOWTO” of the same. Create an excel workbook […]
Continue »{ 12 Comments }
How to Get Unique Items using Excel
Published on Sep 4, 2006 in Analytics, Learn Excel
I recently had to perform some analysis on a set of insurance companies in certain geography. After searching the net I found such list of companies operating in that continent. But the problem is, These companies are listed multiple times, one time for each of their geographical area of operation. I cannot count each company […]
Continue »Being the ad freak that I am, I spend most of the travel time gazing at the billboards inside/outside the local stations. Sometime back the idea of writing an article on these advertisements came to my mind. Here goes the implementation of the same. Spread the buzz! Zee – Bhaskar’s stable is trying to launch […]
Continue »Me had a wonderful weekend. Sorry for the late post. I am busy meeting doctors and gathering their inputs. Anyways, coming back to the weekend stuff, it started on the evening of thursday itself with hairy, karthick (an fms dude) and me watching “Mumbai Expresss“. Not a very great movie. But full of dumb comedy. […]
Continue »Welcome to the bad bad world of marketing surveys and questionnaires. We have a marketing project due in the next couple of days and all of us need to do a customer survey as part of the project. The aim is to suggest marketing strategies for MNCs and multi crore Indian companies based on a […]
Continue »
