Archive for November, 2010
{ 50 Comments }
Excel Animation without Macros!
Published on Nov 30, 2010 in Charts and Graphs, Learn Excel
Today we will learn an interesting animation technique that ONLY uses, … wait for it …, Excel Formulas. That is right, we will use simple formulas to animate values in Excel.
Intrigued? Confused? Interested?
First see a short demo of excel animation achieved using this technique.
Now read the rest of this post to learn more about this technique and download sample workbook.
Continue »{ 29 Comments }
Homework – When does Thanksgiving Day occur on same date again?
Published on Nov 26, 2010 in Learn Excel

It is Thanksgiving day weekend for our friends & readers in USA. That means a good portion of our readers are relaxing with their family and having a good meal. Naturally, we celebrated thanksgiving at our home (we pretty much celebrate any festival as long as eating good food is one of its rituals). I […]
Continue »
WordArt is a quick and easy to use tool to allow Excel users to add pizzazz to the presentation of your worksheets.
This is a quick tutorial in the use of WordArt.
{ 31 Comments }
An Excel Dashboard to Visualize 10,007 Comments [Dashboard Tutorial]
Published on Nov 24, 2010 in Charts and Graphs
![An Excel Dashboard to Visualize 10,007 Comments [Dashboard Tutorial]](https://chandoo.org/img/vp/10007-comments-dashboard-thumb.png)
First some good news, On 21st November, 2010, our little blog received its 10,000th comment!
Thank you so much for making this happen.
Those of you reading chandoo.org for a while know my penchant for comments. I have learned a lot of excel tips & ideas just by reading the comments you posted on this blog. I think comments are one of the best parts of this blog. So, naturally, I wanted to celebrate this milestone, with something big & awesome.
My intention was to download all the 10,000+ comments and play with the data to come up with something outstanding, like a dashboard. It took me 2 days to conceptualize and create this beauty.
Continue »{ 49 Comments }
Splitting a number into integer and decimal portions
Published on Nov 22, 2010 in Excel Howtos, Learn Excel

Here is a quick formula tip to start another awesome week.
Often while working with data, I need to split a number in to integer and decimal portions. Now, there are probably a ton of ways you can do this. But here are two formulas I use quite often and they work well.
Assuming the number is in cell A1,
- Integer part =INT(A1)
- Decimal part =MOD(A1,1)
These formulas work whenever my data has only positive numbers (which is the case 90% 0f time). But if I am dealing with a mix of positive and negative numbers, …
Continue »{ 20 Comments }
VLOOKUP Formula Cheat-sheet – FREE Download
Published on Nov 19, 2010 in Learn Excel

We have talked a lot about VLOOKUP and other lookup formulas recently during VLOOKUP Week.
In this post I am giving away a free VLOOKUP formula cheat-sheet for our readers. This cheat-sheet is prepared by Cheater John specifically for our readers. I hope you enjoy the one page help on VLOOKUP.
Continue »{ 4 Comments }
Scheduling Variable Feed Sources
Published on Nov 18, 2010 in Excel Howtos, Posts by Hui

In many industries, bulk commodities are received or delivered in batches or parcels of various quantities and with various properties.
This post will look at one option for scheduling these commodities within Excel.
{ 33 Comments }
Show Months & Years in Charts without Cluttering
Published on Nov 17, 2010 in Charts and Graphs

We make charts with date axis all the time. So, today we will learn how to set up axis settings in Excel so that Months & Years are shown neatly structured without cluttering your chart. See the example next to understand.
Continue »{ 117 Comments }
Welcome to Chandoo.org. A short introduction to this website
Published on Nov 16, 2010 in blogging
Over the last few weeks we have seen huge influx of new members to our little blog. It is good time I said hello and introduced my site to you.
PS: If you have been at chandoo.org for a while, you can still find a good link or nugget in this post. So read on.
Continue »{ 35 Comments }
Formatting Multiple Worksheets? Use Group Sheets option to Speed up [Quick Tip]
Published on Nov 15, 2010 in Learn Excel
![Formatting Multiple Worksheets? Use Group Sheets option to Speed up [Quick Tip]](https://cache.chandoo.org/images/qts/group-sheets-and-format.gif)
Often we come across workbooks that have similar formatting needs for multiple worksheets. For eg. you may have sales records spanning across 12 worksheets, one for each month. Now as a loyal reader of chandoo.org, you want to keep the formatting of all these worksheets consistent. So here is a quick tip to begin your work week.
Continue »{ 14 Comments }
90% of you can see up to cell M26 & other findings [visualization]
Published on Nov 12, 2010 in Charts and Graphs, Learn Excel
![90% of you can see up to cell M26 & other findings [visualization]](https://chandoo.org/img/vp/last-visible-cell-in-excel-visualization-thumb.png)
Two weeks back I ran a poll asking you to tell me what is the last visible cell in your excel window. It was a casual poll. So I didn’t expect a lot of responses. But, boy I was wrong! 295 of you have responded at last count. This is so much more than what I expected.
As I said, the purpose of this poll is to make a visualization out of the poll responses. In this post you can see the chart(s) I made from this data & learn more.
Continue »
Introducing a method of allowing data points to be interactively highlighted in Excel Scatter / X-Y Charts and Line Charts.
You will see a lot of these style charts in various places where you want to highlight various aspects of the chart to your audience. It is a great technique for complex scientific and engineering charts where you may have hundreds or thousands of points.
{ 58 Comments }
Getting the 2nd matching value from a list using VLOOKUP formula
Published on Nov 10, 2010 in Learn Excel

Situation
We know that VLOOKUP formula is useful to fetch the first matching item from a list. So what would you do if you need 2nd (or 3rd etc.) matching item from a list?
For eg. If you have below data, and you want to find out how much sales John made 2nd time, then VLOOKUP formula becomes quite useless. Or is it?!?
Read more to find how to solve this.
Continue »{ 53 Comments }
How to write 2 Way Lookup Formulas in Excel?
Published on Nov 9, 2010 in Learn Excel
Situation
So far we have seen what VLOOKUP formula is and how to put it to some nifty uses. Today, we will go one step further and learn how to do 2 Way Lookups.
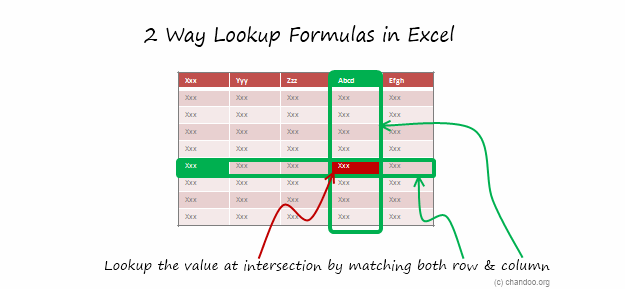
What is a 2 Way Lookup?
Lookup is when you find a value in one column and get the corresponding element from other columns. 2 Way Lookup is when you lookup value at the interesection corresponding to a given row & column values.
For example, assuming you have data like below, and you want to findout how much sales Joseph made in month of March, you are essentially doing a 2 way lookup.
Read more to find how to solve this.
Continue »{ 6 Comments }
Using Lookup Formulas with Excel Tables [Video]
Published on Nov 9, 2010 in Learn Excel
Excel Tables, a newly introduced feature in Excel 2007 is a very powerful way to manage & work with tabular data. I really like tables feature and use it quite often. If you are new to tables, read up Introduction to Excel Tables.
In this short video tutorial I explain how to combine VLOOKUP, INDEX, MATCH formulas with Excel Tables.
Continue »
