All articles with 'pivot tables' Tag
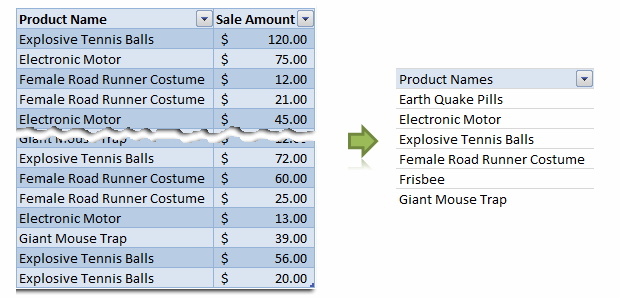
Removing duplicate data is like morning coffee for us, data analysts. Our day must start with it. It is no wonder that I have written extensively about it (here: 1, 2, 3, 4, 5, 6, 7, 8). But today I want to show you a technique I have been using to dynamically extract and sort […]
Continue »{ 1 Comment }
How I Analyze Excel School Sales using Pivot Tables [video]
Published on Sep 22, 2010 in Charts and Graphs, Pivot Tables & Charts
Some of you know that I run an online excel training program called Excel School. If you want to join, click here. Only 8 days left.
I run excel school mainly to meet new students, understand their problems and learn new ways to solve them. But, Excel School also presents me with an interesting analytics challenges. In this post, I will share 2 pivot table based analytic techniques I used just yesterday to answer few questions I had about Excel School sign-ups.
Watch this 15 min. video to see how I analyzed the data
Continue »{ 101 Comments }
What is new in Microsoft Excel 2010? [Office 2010 Week]
Published on May 17, 2010 in Featured, Learn Excel
![What is new in Microsoft Excel 2010? [Office 2010 Week]](https://chandoo.org/img/2010/excel-2010-whats-new.png)
Office 2010, the latest and greatest version of Microsoft Office Productivity applications is going to be available worldwide in the next few weeks. I have been using Office 2010 beta since November last year and recently upgraded my installation to the RTM version. I was pleasantly surprised when I ran Microsoft Excel 2010 for first time. It felt smooth, fast, responsive and looked great on my comp.
This week, I want to celebrate the launch of Excel 2010 and write about the following new features in Excel 2010.
Also, you can win a copy of Office 2010 – home & student edition by leaving a comment on this or any of the other excel 2010 posts scheduled for this week
Continue »It has been quite a while since we had an excel links post. It doesn’t mean that I am not reading anything new on excel or charting. I have been reading lots of awesome articles and useful content and sharing it on my google reader recommendation list. But it is just that I have been […]
Continue »{ 5 Comments }
Quarterly totals when you have multi-year data [SUMPRODUCT again]
Published on Apr 30, 2010 in Excel Howtos, Learn Excel
![Quarterly totals when you have multi-year data [SUMPRODUCT again]](https://img.chandoo.org/f/quarterly-totals-multi-year-data.png)
In yesterdays post – Find Quarterly Totals from Monthly Data, we have learned how to use SUMPRODUCT formula to find totals by Quarter from a set of monthly values. The approach is fine, but has one glaring draw back. It only works when you have data for one year. In that post, Martin said, … […]
Continue »{ 34 Comments }
Find Quarterly Totals from Monthly Data [SUMPRODUCT Formula]
Published on Apr 29, 2010 in Excel Howtos, Learn Excel
![Find Quarterly Totals from Monthly Data [SUMPRODUCT Formula]](https://img.chandoo.org/f/quarterly-totals-from-monthly-data.png)
Here is a problem we face very frequently. You have a list of values by months. And you want to find out the totals by Quarter. How do you go about it? There are 2 options: You can make a pivot report from the data and then group dates in that to find totals by […]
Continue »{ 17 Comments }
Budget vs. Actual Profit Loss Report using Pivot Tables
Published on Apr 21, 2010 in Learn Excel, Pivot Tables & Charts
This is continuation of our earlier post Preparing Quarterly and Half yearly P&L using grouping option. You can also do budget v/s actual comparison using Pivot Tables. For this we will use calculated items feature of Excel PivotTables.
To begin, we have to add one more column to our data. I have added column Data Source to the end of data table. Existing data is marked as Actual and I have added more data rows which are marked as Budget. You can download new file with updated data and basic Pivot P&L.
Continue »{ 5 Comments }
Quarterly & Half-Yearly Profit Loss Reports [Part 5 of 6]
Published on Mar 24, 2010 in Learn Excel, Pivot Tables & Charts
![Quarterly & Half-Yearly Profit Loss Reports [Part 5 of 6]](https://chandoo.org/img/ea/quarterly-half-yearly-profit-loss-reports-excel.png)
This is continuation of our earlier post Exploring Pivot Table P&L Reports.
We have learned how to change our P&L report on various data elements. We have seen how the P&L report can be changed with just few clicks.
In this post we will be learning some grouping tricks in PivotTables. We will cover grouping of dates, text fields and numeric fields. You will need to start with Monthly P&L report prepared in previous post. We will also learn some really clever tricks and hacks on how to group data in Pivot Tables. So read on…,
Continue »
In October 2008, I have started an ambitious series of posts on this blog called – Spreadcheats. These are little tricks, nuggets, tutorials on using Excel that would make anyone a spreadsheet guru.
The spreadcheats series has been wildly successful. I am compiling all this useful information and articles in to one big post so that anyone can follow the links and become good in Excel. Read on,
[Note: This is not for beginners. If you know what a formula is, you would enjoy this 31 articles]
Continue »{ 7 Comments }
Exploring Profit & Loss Reports [Part 4 of 6]
Published on Mar 3, 2010 in Learn Excel, Pivot Tables & Charts
![Exploring Profit & Loss Reports [Part 4 of 6]](https://chandoo.org/img/ea/profit-loss-report-pivot-options-4.png)
This is part 4 of 6 on Profit & Loss Reporting using Excel series, written by Yogesh Data sheet structure for Preparing P&L using Pivot Tables Preparing Pivot Table P&L using Data sheet Adding Calculated Fields to Pivot Table P&L Exploring Pivot Table P&L Reports Quarterly and Half yearly Profit Loss Reports in Excel Budget […]
Continue »{ 20 Comments }
Adding Calculated Fields to Pivot Table P&L [part 3 of 6]
Published on Feb 25, 2010 in Learn Excel, Pivot Tables & Charts
![Adding Calculated Fields to Pivot Table P&L [part 3 of 6]](https://chandoo.org/img/ea/profit-loss-report-with-calculated-fields.png)
This is part 3 of 6 on Profit & Loss Reporting using Excel series, written by Yogesh Data sheet structure for Preparing P&L using Pivot Tables Preparing Pivot Table P&L using Data sheet Adding Calculated Fields to Pivot Table P&L Exploring Pivot Table P&L Reports Quarterly and Half yearly Profit Loss Reports in Excel Budget […]
Continue »{ 5 Comments }
Preparing Profit / Loss Pivot Reports [Part 2 of 6]
Published on Feb 10, 2010 in Learn Excel, Pivot Tables & Charts
![Preparing Profit / Loss Pivot Reports [Part 2 of 6]](https://chandoo.org/img/ea/profit-loss-reports-2.png)
This is part 2 of 6 on Profit & Loss Reporting using Excel, written by Yogesh Data sheet structure for Preparing P&L using Pivot Tables Preparing Pivot Table P&L using Data sheet Adding Calculated Fields to Pivot Table P&L Exploring Pivot Table P&L Reports Quarterly and Half yearly Profit Loss Reports in Excel Budget V/s […]
Continue »{ 16 Comments }
P&L Reporting using Excel [Part 1 of 6 on Excel & Accounting]
Published on Feb 4, 2010 in Learn Excel, Pivot Tables & Charts
![P&L Reporting using Excel [Part 1 of 6 on Excel & Accounting]](https://chandoo.org/img/ea/excel-accounting-pl-reports-1.png)
With this post we are starting a new series on how to do basic accounting in Microsoft Excel. In this and next 5 posts, we will aim to setup Profit & Loss account reporting for multi-location retail company.
During this series we will learn how to make P&L reports on various criteria with just few clicks.
Many users find it difficult to manage their P&L reporting for Multi Location organization.
We will be using Pivot Tables for our reporting purpose and will take example of a Retails chain with multiple locations divided into various regions.
Continue »{ 13 Comments }
Data Validation using an Unsorted column with Duplicate Entries as a Source List
Published on Feb 2, 2010 in Learn Excel
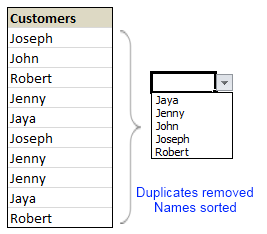
Here is a typical scenario: We want to allow only one of the pre-defined customer names in our spreadsheet. We have listed down all the customers in column B and want excel to check against this list and validate the data. But there are 3 problems. (1) Our list is not sorted alphabetically (2) It contains duplicates and (3) The list comes from external source, so we can not remove duplicates and sort the list every time.
Now how can we set up a simple data validation list that would not repeat customer names and shows them in sorted order like this.
Read the rest of this guest post by Hui to learn how to use data validation in creative new ways.
Continue »{ 142 Comments }
Pivot Table Tricks to Make You a Star
Published on Jan 27, 2010 in Featured, Learn Excel
We, data junkies, love pivot tables. We think pivot tables are solution for everything (except for may be global warming and that broken espresso machine down stairs).
Today, we are going to learn 5 awesome pivot table tricks that will make you a star.
Continue »
