All articles with 'MS' Tag
Would you like to spend next 5 minutes learning how to create an mutual fund tracker excel sheet?
Make a live, updatable mutual fund portfolio tracker for Indian markets to keep track of your investments using this example.
Continue »{ 17 Comments }
Generating invoice numbers using excel [reader questions]
Published on Jul 20, 2009 in Excel Howtos, Learn Excel
![Generating invoice numbers using excel [reader questions]](https://chandoo.org/img/l/invoice-numbers.gif)
Learn how to generate invoice numbers, tax codes etc. using Microsoft Excel. In this example we will take a real life example shared by Michelle and findout how we can generate invoice numbers using excel formulas. Read more to learn and download the example workbook.
Continue »{ 19 Comments }
Make an Impressive Product Catalog [spreadsheets for small business]
Published on Jul 13, 2009 in excel apps, Learn Excel
![Make an Impressive Product Catalog [spreadsheets for small business]](https://chandoo.org/img/l/product-catalog-small-business-spreadsheet.gif)
It is the customer on the phone again, she wants to know what products we have.
How cool would it be if we can send her a spreadsheet with all the products neatly listed in a table and she can use filters to find what she likes. Alas, we end up sending a biggish PDF brochure that is both difficult to make and maintain.
Well, not any more.
Today we will learn a very useful and fun trick in Excel. We will create a product catalog using Excel that you can send to your clients or boss (and impress them).
Continue »{ 17 Comments }
Asset Allocation Chart Turns Zombie [ChartBusters #1]
Published on Jun 19, 2009 in Charts and Graphs
![Asset Allocation Chart Turns Zombie [ChartBusters #1]](https://chandoo.org/img/cb/bad-asset-allocation-chart-donut.png)
In this installment we take a look at Asset Allocation Chart that looks like it is hexed. Our reader DMurphy submitted this.
Continue »
Most of us think of mastering formulas, learning macros and being supergood with charts when we think of being productive with spreadsheets. But often learning simple stuff like keyboard shortcuts, using mouse and working with menus and ribbons can be a huge productivity booster for us. So as part of this installment of spreadcheats we […]
Continue »{ 21 Comments }
Incell Dot Plots in Microsoft Excel
Published on Jun 10, 2009 in Charts and Graphs, Learn Excel

Dot plots are a very popular and effective charts. According to wikipedia “Dot plots are one of the simplest plots available, and are suitable for small to moderate sized data sets. They are useful for highlighting clusters and gaps, as well as outliers.”
Today we will learn about creating in-cell dot plots using excel. We will see how we can create a dot plot using 3 data series of some fictitious data.
Continue »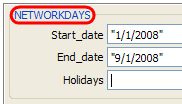
We all know that networkdays() an extremely powerful and simple excel formula can help you calculate no. of working days between 2 given dates.
But there is one problem with it. It assumes 5 day workweek starting with Monday to Friday. Not all countries have workweek from Monday to Friday.
This got me thinking and I ended up writing a user defined formula (UDF) to calculate working days between 2 given dates with any criteria. This will be good for calculating payrolls for temporary workers, offshore partners and of course people working countries where Saturday or Sunday or not usually holidays.
Continue »{ 0 Comments }
Excel Formula 1 – Really Fast way to learn Excel Formulas
Published on Jun 8, 2009 in Learn Excel
Okay, that may appear a bit too fast. But the new improved version of our excel formulas e-book, now called “Excel Formula 1” is out today. I have included 25 more formulas and improved the content and layout greatly. The book costs $10 and you can buy it from here. If you want to be […]
Continue »Here is a very quick tip if you ever want to hide a cell’s contents in excel
Just use the custom cell formatting (more here) code ;;;
Continue »{ 72 Comments }
Statistical Distributions in Excel [spreadcheats]
Published on Jun 1, 2009 in Learn Excel
![Statistical Distributions in Excel [spreadcheats]](https://chandoo.org/img/n/frequency-excel-formula.png)
Excel has very powerful formulas and add-ins for performing almost any kind of statistical analysis. Today we will learn how you can make a statistical distribution of test scores using excel. There is a downloadable workbook too, for you to take a look at the formulas and play with them.
Continue »{ 42 Comments }
Do you know these Excel 2007 Productivity Secrets (Hint: Coffee is not one of them)
Published on May 26, 2009 in Excel Howtos, Learn Excel
Do you know these excel 2007 productivity secrets? (1) How to turn on the clipboard pane so that you can do rapid copy pasting (2) How to lock a feature for repeated use (3) How to copy charts as pictures (4) How to features not on ribbon to the quick access tool bar (5) How to change the default file save settings so that excel always save files in earlier version and much more. Go ahead and read the secrets and become excel guru.
Continue »{ 5 Comments }
Excel Links – Dilbert is Recession-proof Edition
Published on May 25, 2009 in excel links
In this week’s excel links, we will learn how to jump to next cell during data entry, an array formula trick to include all values conditionally, about auto-filters in excel and much more.
Continue »![Create a Dynamic Chart in Excel in 2 Minutes [spreadcheats]](https://chandoo.org/img/n/dynamic-charts-excel-demo.gif)
Here is a really fun and simple way to create dynamic charts in Excel. It uses data filters in an innovative way and creates the dynamic effect. To create the dynamic charts, just follow these 5 steps:
(1) Prepare your charts: Make as many charts as you want. Lets say 3.
(2) Set up the area where dynamic charts will be loaded: Just take 3 cells in a row and adjust the row height and column width such that the charts can be fit inside snugly. Also, type the chart names (1 for each cell) in the cell. Let us say, the charts you have are for Costs, Sales and Profits, just type these names in the cells.
Read more…
{ 6 Comments }
Excel Tips Submitted by You [Part 3]
Published on May 13, 2009 in Excel Howtos, Learn Excel
In the third installment of your week at PHD, we have a fantastic tutorial on R1C1 style of formula referencing, a nifty vlookup hack and adding web toolbars to excel UI. We have one more day to go, so rush!
Continue »{ 12 Comments }
Use Mouse to Edit Formula Ranges [quick tip]
Published on May 5, 2009 in Learn Excel
![Use Mouse to Edit Formula Ranges [quick tip]](https://chandoo.org/img/n/formula-range-edit-using-mouse.gif)
Here is a fun way to edit formula ranges. Just select the formula, press F2 and when you see the borders around the ranges used in that formula start dragging / resizing these borders to edit the formula range.
Continue »
