All articles with 'microsoft' Tag
{ 19 Comments }
Switch Rows and Columns in Charts [Quick Charting Tip]
Published on Nov 2, 2009 in Charts and Graphs, Excel Howtos
![Switch Rows and Columns in Charts [Quick Charting Tip]](http://chandoo.org/img/c/switch-rows-columns-in-charts.png)
Let us say you have built a nice chart showing your sales and profits for the top 5 products (learn how to highlight top 5 products in a list), with products on X axis. Suddenly your boss wants to switch the rows to columns (or transpose the chart) so that she can see metric level grouping instead of product level grouping. No need to freak out and rush to Espresso machine, You can do it very easily with Excel Charting features.
In today’s quick tip you will learn how to swap chart rows and columns in excel.
Continue »{ 11 Comments }
Copy Data Validations from one cell to another [quick tip]
Published on Oct 28, 2009 in Excel Howtos
![Copy Data Validations from one cell to another [quick tip]](http://chandoo.org/img/i/copy-data-validations.png)
If only there is paste special for everything in life, things would be much more smoother and fun. Alas, the paste special is limited only to excel.
Here is a handy trick you can use to quickly scale up data validations set up in one cell to say a range of cells.
Just copy the cell by pressing CTRL+C and then go to the target cell(s) and press ALT+ESN. And your data validations are pasted in the new cells. That is all. Quick and Easy.
Continue »{ 7 Comments }
Project Dashboard + Tweetboard = pure awesomeness!!!
Published on Oct 27, 2009 in Charts and Graphs
Check out an implementation of project dashboard along with tweetboard by our reader Fernando. He says, it “turned out to be a great success”. I am so happy for him.
Btw, the post includes a link to download the workbook so that you can see the dashboard and tweetboard in action.
Continue »{ 42 Comments }
Prevent Duplicate Data Entry using Cell Validations
Published on Oct 26, 2009 in Excel Howtos

We all know that data validation is a very useful feature in Excel. You can use data validation to create a drop-down list in a cell and limit the values user can enter. But, do you know that you can use data validation in a multitude of ways to prevent users from entering wrong data?
Here is a practical application: Prevent users from entering duplicate values in a range of cells.
For eg. you are making an invoice. Wouldn’t it be cool if Excel prompted you when you enter a duplicate line item so that increase the item quantity instead of repeating it.
Continue »{ 13 Comments }
Solve Sudoku Puzzles using Excel [because it is weekend]
Published on Oct 23, 2009 in VBA Macros
![Solve Sudoku Puzzles using Excel [because it is weekend]](http://chandoo.org/img/i/sudoku-solver-using-excel.png)
Sanjay, my colleague is an avid programmer and excel enthusiast. In his spare time he wrote a small VBA macro to solve Sudoku. Sudoku is a very famous number based puzzle with a 9×9 grid of cells. Each of the 9 rows, columns and 3×3 blocks should be filled in such a way that they have all the numbers from 1 to 9. Sudoku is a very effective way to keep your brain cells ticking. I am a huge sudoku fan and I solve sudoku whenever I have few minutes to kill. So naturally I jumped with joy when I saw Sanjay’s excel macro for solving sudoku. He is kind enough to let me share this with all of you.
Continue »
I have a super exciting news for all our members. During the last several weeks, I have been working on making 24 strikingly remarkable and easy to use excel templates for better project management. Finally the bundle is ready. You can get a copy of the bundle starting today.
Continue »{ 8 Comments }
Another Reason why Tables are so awesome [quick tip]
Published on Oct 8, 2009 in Excel Howtos
![Another Reason why Tables are so awesome [quick tip]](http://chandoo.org/img/l/excel-table-scroll-feature.png)
Ever since I have learned the tables feature in Excel 2007, I have fallen in love with that. They are so awesome and so user friendly.
Here is a simple, yet very effective feature of Excel Tables that will show table header row even when you scroll down. The header row is shown in the place of column headings (the place where you see A,B,C,D etc.).
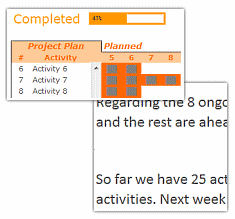
Continue »![Project Management Dashboard / Project Status Report using Excel [Part 6 of 6]](http://chandoo.org/img/pm/project-status-dashboard-th.png)
Project management dashboards, project status reports help stakeholders, project sponsors and team-members can understand project status very quickly. In the last installment of project management using excel, learn how to make project management dashboard using excel in this tutorial. Also download the excel project status dashboard template.
Continue »{ 15 Comments }
Make a Bubble Chart in Excel [15 second tutorial]
Published on Oct 5, 2009 in Charts and Graphs, Excel Howtos
![Make a Bubble Chart in Excel [15 second tutorial]](http://chandoo.org/img/l/bubble-chart-excel-tutorial.png)
A Bubble chart displays circles (or bubbles) at given X and Y co-ordinates. Bubble chart is a very good way to show 3 dimensional data (for eg. Region-wise product sales) without confusing users. In this tutorial, we will learn how to create a bubble chart using excel.
Continue »{ 11 Comments }
Use Cell Styles to Make your Spreadsheet Models User-friendly [Quick Tip]
Published on Oct 1, 2009 in Excel Howtos, Learn Excel
![Use Cell Styles to Make your Spreadsheet Models User-friendly [Quick Tip]](http://chandoo.org/img/i/use-excel-cell-styles.png)
Spreadsheet modeling or scenario modeling is one of the common uses of Microsoft Excel. People, especially in financial sector use MS Excel to do a lot of modeling. While excel has such powerful features like goal seek and scenarios, it also has a very useful feature called “cell styles” that you can exploit to make […]
Continue »{ 6 Comments }
Twins, Clones and Duplicates – 6 Excel Shortcuts from an Excited Dad
Published on Sep 25, 2009 in Charts and Graphs, Learn Excel

I could barely sleep last night. Even though I came home, my heart was in that hospital room only. I got up at 5:30, and came to see my wife and kids by 7:30. Now that they all are sleeping, I can quickly whip an excel post, to help you make twins, clones and duplicates.
Continue »{ 12 Comments }
7 ideas Excel can pick-up from iWork Numbers
Published on Sep 21, 2009 in Charts and Graphs, Learn Excel

We have a macbook at home. Like all latest macbooks, this one too came with a trail version of iWork. Even though I have used iWork before, this time I wanted to compare iWork numbers with Excel. In this post, I want to highlight 7 really cool features for iWork and how Microsoft excel can benefit from implementing the same.
Continue »{ 15 Comments }
How to get tick marks in Excel? [custom cell formatting]
Published on Sep 15, 2009 in Excel Howtos, Learn Excel
![How to get tick marks in Excel? [custom cell formatting]](http://chandoo.org/img/i/showing-tick-marks-using-excel.png)
Here is tricky scenario, faced by Basil, our forum member, “I want to have Excel display a wing ding check mark when a user types “y” in a cell. I have been trying to do a substitute formula but putting the symbol in an unused portion of the spreadsheet and calling it to the selected cell but I can’t get it to work. Any thoughts?”
We can use either cell formatting or conditional formatting to achieve this.
Continue »{ 3 Comments }
Pin Frequently Used Documents to File Menu to Save Time
Published on Sep 4, 2009 in Learn Excel
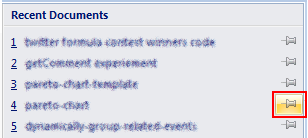
Here is a quick productivity tip if you work with same set of excel (or word or powerpoint) documents everyday. Just pin the documents to recent documents list in the Office Menu in MS Office 2007. See this: More excel 2007 productivity tips & double click tricks.
Continue »{ 10 Comments }
Using Combo Charts to Group Related Time Events [Charting Goodness]
Published on Aug 26, 2009 in Charts and Graphs
![Using Combo Charts to Group Related Time Events [Charting Goodness]](https://chandoo.org/wp/wp-content/uploads/2009/08/excel-combo-chart-th.png)
In his latest book, Now You See It, on pages 165 and 166 of the book, Stephen Few discusses how grouping related time intervals can facilitate analysis of data. As an illustration he explains that when viewing data of daily website visits, it helps in separating weekdays and weekends to differentiate expected traffic during these periods. The use of this technique would make it easier for the analyst to identify any anomalous movement in ether the weekend or the week day.
Fortunately excel combo charts can help you do that. In this guest post, Paresh explains to us how to do this.
Continue »
