All articles with 'hacks' Tag
Make a Dynamic Chart using Data Filters

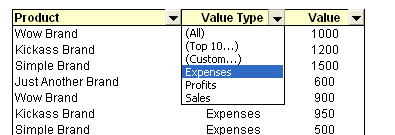
As part of our spreadcheats series, we will learn how you can use data filters to create dynamic charts in Microsoft excel
Continue »
Often when you are writing code or testing an application, it might be helpful to have random phone numbers generated for you. Here is an excel formula that I use: =value(left(substitute(rand(),”0.”,””),10)) try these 2 instead (thanks to John) =RAND()*(9999999999-1000000000)+1000000000 =RANDBETWEEN(1000000000,9999999999) [needs analysis toolpack add-in or excel 2007] Even though it works most of the time […]
Continue »
Yesterday I have learned this cool excel charting trick and I cant wait to share it with you all. The problem: I have too many charts & want to show one based on selection You have made 3 charts to show your company performance in the last 8 years. But you don’t want to clutter […]
Continue »
Sorting text is such a day to day activity that it always surprises me why Excel hasn’t provided a simple spreadsheet formula for doing it. Of course you can use the sorting menu command (menu > data > sort) but this requires manual steps (or VBA). Most of the times we get raw textual data […]
Continue »
In Petal Charts – an Alternative to Radar Charts I have suggested using a radar chart tweak to replace the radar charts. Both PTSBlog and Information Ocean have posted their critical reviews of these petal charts. So as a penance for proposing petals, I am going to provide a tutorial on creating a comparison table […]
Continue »Simple Todo List application using Excel – Download and become productive

After seeing Andrew’s simple excel based check-list I got this idea of preparing a simple To-Do list application using excel. Since most of us use Excel on day to day basis, why not use it as a productivity application as well by keeping track of all the things we must do (TO DO List). When […]
Continue »
Gauges are a familiar metaphor, everyone can understand them, you can see them everywhere – near your stove, ac, car, gaming console, pc – you name it. So, when you are preparing a chart to tell a point, gauge chart like the one above can be effective. (I know charting pros like Jon Peltier wouldn’t […]
Continue »Bingo / Housie Ticket Generator in Excel

I am fascinated by board games. They provide immense fun, anyone can enjoy them, they are unpredictable and best of all they are great value for money. That is why whenever I get sometime I experiment with simulating games to know them better. So, out of curiosity I have created an excel sheet that can generate bingo / housie (housey) tickets – 24 of them at a time. To get new set of tickets you would hit F9 (recalculate).
Continue »How geeky are you? Show off your geekness to others with this kickass room decor ideas, Just click the images to follow up. live geek, love geek 😀 1. Lets start with the door. You can experiment with the door locks to create your own puzzle: 2. Now that you are in how geeky would […]
Continue »Jon @ Peltiertech has taken a critical look at the partition charts suggested yesterday. You can read his review of the partition charts here. One of the commenters on his site said, Jon, the partition chart is not that bad. It just needs to be defragmented… 🙂 So I de-fragmented my partition chart, this time […]
Continue »While trying to understand how the Mozilla firefox search plug-ins work [ more ] I got curious and wrote a search plug-in that will take you to the first Google search result directly instead of displaying the results pages, ie mimicking the “I am feeling lucky” searches. Feel free to download and install it. 1. […]
Continue »After seeing DI’s Open Your Favorite Websites Directly from Windows Vista Start post, I thought why not use Windows XP Run dialog box as a search box. So here is a simple trick that can enable you to open your favorite sites directly from XP’s run dialog box. Using this trick you can type “g […]
Continue »Here is a ridiculously simple workaround for those of you trying to generate an organization chart in excel: Use google org. chart widget instead 🙂 [If you are reading this in a feedreader this post may not display properly, visit the post page instead.] Open a new google docs spreadsheet (or work on the example […]
Continue »Here is a simple to trick to beat the 56 color limitation in excel when you are designing a chart: use picture files (jpg, gif, png etc.) to fill the chart area. You will no longer have to worry about limiting your project report / website / annual report etc. colors to the 56 that […]
Continue »73 Free Designer Quality Excel Chart Templates – Grab now and become a charting superman
How many times you created a chart in Microsoft excel and formatted it for minutes (and sometimes hours) to reduce the eye-sore? Well, I will tell you my answer, its 293049430493 times 😉 Worry not! for you can become a charting superman (or elastigirl) by using these 73 free designer quality chart templates in literally […]
Continue »

