Calculating Critical Path using Excel Formulas [Project Management]

Do you know that we can easily calculate the critical path for a project using Excel formulas?
For a long time, it has been tricky to calculate the Critical Path using Excel formulas. But thanks to the arrival of new Dynamic Array functionality in Excel, we can now calculate critical path. In this article let me describe the approach with an example.
Put on your hardhats, this one is going to blow your minds.
Project Plan – Gantt Chart with drill-down capability [Templates]

Create a gantt chart with ability to filter by levels. This drill-down gantt chart in Excel is useful for seeing activities by module or team. Read on for full instructions + downloadable template.
CP046: Gantt charts & project planning using Excel
Podcast: Play in new window | Download
Subscribe: Apple Podcasts | Spotify | RSS
In the 46th session of Chandoo.org podcast, let’s talk about gantt charts and project plans.
What is in this session?
In this podcast,
- A brief intro to Excel 2016
- What is a Gantt chart?
- How Gantt charts can help us?
- How to create Gantt charts in Excel
- Using bar charts with invisible series
- Using conditional formatting and formulas
- Using ready-made templates
- Resources on Gantt charts & project planning
- Conclusions
Quick and easy Gantt chart using Excel [templates]
Gantt charts are a very popular way to visually depict project plans. Today, let us learn how to use Excel to make quick & easy Project Plan Gantt Chart.
This is what we will be creating.
Designing a dashboard to track Employee vacations [case study]

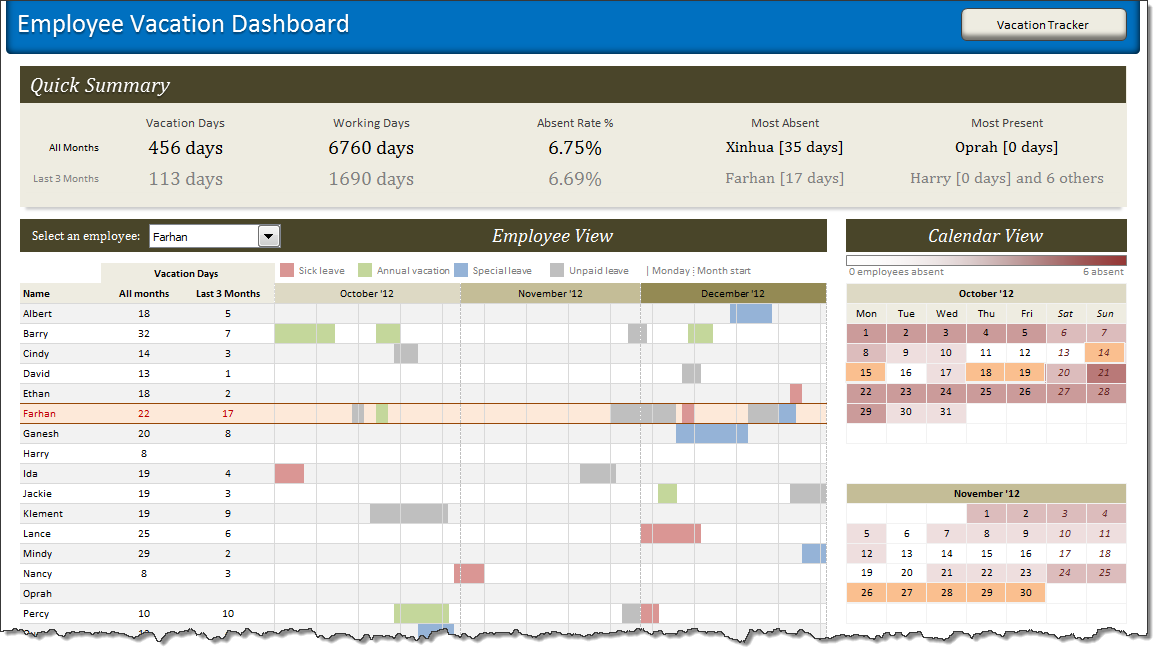
HR managers & department heads always ask, “So what is the vacation pattern of our employees? What is our average absent rate?”
Today lets tackle that question and learn how to create a dashboard to monitor employee vacations.
What do HR Managers need? (end user needs)
There are 2 aspects tracking vacations.
1. Data entry for vacations taken by employees
2. Status dashboard to summarize vacation data
Gantt Box Chart Tutorial & Template – Download and Try today
On Firday, we proposed a new chart for showing project plans. I chose an ugly name for it and called it Gantt Box Chart. Essentially, a gantt box chart is what you get when a gantt chart and box plot go to a bar, get drunk and decide to make out. It shows the project […]
A Gantt Chart Alternative – Gantt Box Chart
Traditional project plans use Gantt Charts to depict the plan. While gantt charts work great and provide instant picture of overall plan, they fail to communicate the uncertainty in the plan. In most real world projects, the plans always change. Most of the management energy is spent on controlling and communicating about this plan uncertainty. This is where a project plan like gantt box chart can help. This chart (as shown above) clearly shows the variance in end dates of project tasks thus giving a clear picture of uncertainty in the plan. Read more to find out how this chart can be used in project management.