All articles with 'Microsoft Excel Formulas' Tag
Use NUMBERVALUE() to convert European Number format
If you deal with customers or colleagues in Europe, often you may see numbers like this:
- 1.433.502,50
- 9.324,00
- 3,141593
When these numbers are pasted in Excel, they become text, because Excel can’t understand them.
Here is a simple way to convert the European numbers to regular ones.
Use NUMBERVALUE() Function.
Continue »Weighted Sorting in Excel [video]
![Weighted Sorting in Excel [video]](https://chandoo.org/wp/wp-content/uploads/2015/10/weighted-sort-in-excel.png)
Imagine you are looking customer data like below and want to sort them by performance. If you sort the data by any one column, you will not get full picture of performance. To understand which customers rank low on performance, you need to defined a weighed sort, the kind of sort where you assign weights to each attribute (customer age, recent purchases and rate of returns) and come up with single score to sort them all.
Sounds interesting? Watch below video to understand how to do weighted sorting in Excel.
Continue »How countries spend their money – chart alternatives
Econimist’s daily chart is a one of my daily data porn stops. They take interesting data sets and visualize in compelling ways. While the daily chart page is insightful, sometimes they make poor charting choices. For example, this recent chart visualizing how countries spend their money uses a variation of notorious bubble chart. Click on the chart to enlarge.
What is wrong with this chart?
Bubble charts force us to measure and compare areas of circles. Unless you have a measuring tape somehow embedded in your eyes and you are a walking human scientific calculator, you would find this task impossible.
So when you look at the chart and want to find out what percentage Japanese spend on restaurants or how much Americans pay for housing, your guesses will have large error margins.
Not only bubble charts are difficult to read, they are very hard to align. So when you have a bunch of bubbles, no matter how hard you try, your chart looks clumsy (see how the Russian food bubble eats in to Mexico’s bubble, as if it is too hungry 😉 )
Let’s check out a few alternatives to this chart. Read on…
Continue »
We all know that VLOOKUP (and its cousins MATCH, HLOOKUP and LOOKUP) are great for finding information you want. But they are helpless when you want to do a case-sensitive lookup.
So how do we write case sensitive VLOOKUP formulas?
Simple. We can use EXACT formula.
Continue »Time for a quick weekend poll. What is your favorite tool for data analysis?
- Formulas
- Pivot Tables
- Or both
Post your choice in the comments. Also mention the number of years Excel experience you have.
For ex, my answer is: Both (10 years)
Continue »Build models & dashboards faster with Watch Window

Here is a familiar scenario: You are building a dashboard. Naturally, it has a few worksheets – data, assumptions, calculations and output. As you make changes to input data, you constantly switch to calculations (or output) page to check if the numbers are calculating as desired. This back and forth is slows you down.
Use Watch Window to reduce development time.
Continue »How to use GETPIVOTDATA with Excel Pivot Tables

Pivot tables are very powerful analysis tools. They can summarize vast amounts of data with just few clicks. But they are lousy when it comes to output. Imagine the horror of putting a pivot table right inside your beautiful dashboard. One refresh could ruin the layout and create half-an-hour extra work for you.
How to combine the power of pivot tables with elegance of your dashboards?
The answer is: GETPIVOTDATA()
Continue »Summarize only filtered values using SUBTOTAL & AGGREGATE formulas

We all know the good old SUM() formula. It can sum up values in a range. But what if you want to sum up only filtered values in a range? SUM() doesn’t care if a value is filtered or not. It just sums up the numbers. But there are other formulas that can pay attention […]
Continue »Give descriptive titles to your charts for best results

Here is a simple & effective tip on charting.
Give your charts descriptive & bold titles.
How to set up title that are smart & descriptive?
Simple, follow below steps.
- Create the title you want in a cell
- Select the chart title
- Go to formula bar, press = and point to the cell with title
- Press enter.
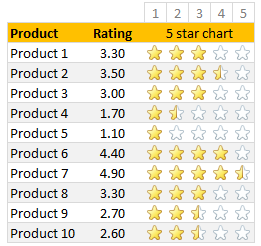
In-cell 5 star chart – tutorial & template

Whenever we talk about product ratings & customer satisfaction, 5 star ratings come to our mind. Today, let’s learn how to create a simple & elegant 5 star in-cell chart in Excel. Something like above.
Read on to learn how to create the above chart.
Continue »
VLOOKUP is one of the most useful Excel functions. So much so that I even wrote a book about it. But it has one serious limitation.
It looks up the first occurrence and returns corresponding data.
What if you want to find the last value?
Say, for example, you are looking at a task assignment list and want to know what is the last task assigned to employee Emp13?
We want to extract the task “Make amazing workbook”. Of course our good old VLOOKUP stops once it finds Emp13 and returns the answer as “Create intuitive workbook”.
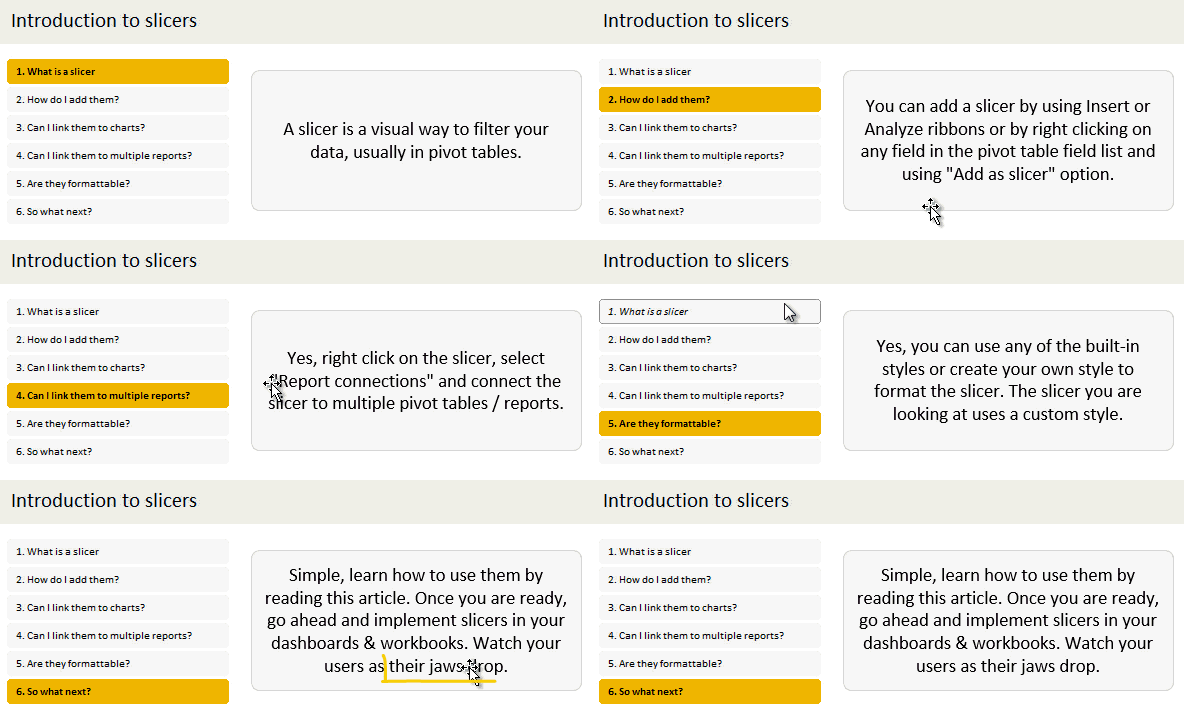
Continue »Introduction to Slicers – What are they, how to use them, tips, advanced techniques & interactive reports using Excel Slicers

Slicers are one of my favorite feature in Excel. And here is a quick demo to show why they are my favorite.
Slicers – what are they?
Slicers are visual filters. Using a slicer, you can filter your data (or pivot table, pivot chart) by clicking on the type of data you want.
For example, let’s say you are looking at sales by customer profession in a pivot report. And you want to see how the sales are for a particular region. There are 2 options for you do drill down to an individual region level.
- Add region as report filter and filter for the region you want.
- Add a slicer on region and click on the region you want.
With a report filter (or any other filter), you will have to click several times to pick one store. With slicers, it is a matter of simple click.
Read more to learn all about slicers
Continue »Calculating Billy’s total working hours [solution & discussion]
Few days ago, I asked you “How many hours did Billy work?” There were more than 100 responses with lots of innovative solutions.
So today, let’s examine various ways to calculate total working hours given start & end times of tasks. Please watch below video.
Calculating Bill’s total working hours (video)
Continue »Ensure cleaner input dates with conditional formatting [quick tip]
![Ensure cleaner input dates with conditional formatting [quick tip]](https://chandoo.org/wp/wp-content/uploads/2015/05/cleaner-dates-demo.gif)
Here is a familiar problem: You create a workbook to track some data. You ask your staff to fill up the data. Almost all the input data is fine, except the date column. Every one types dates in their own format. Here is a fun, simple & powerful way to warn your users when they […]
Continue »Find and Highlight all blank cells in your data [Excel tips]
![Find and Highlight all blank cells in your data [Excel tips]](https://chandoo.org/wp/wp-content/uploads/2015/04/find-highlight-blank-cells-in-excel.png)
True story:
On Friday (17th April – 2015), I flew from Vizag (my town) to Hyderabad so that I can catch a flight to San Francisco to attend a conference. As I had 10 hours of overlay between the flights in Hyderabad, I checked in to a lounge area so that I can watch some sports, eat food while pretending to do work on my laptop. There was a gentleman sitting in adjacent space doing some work in Excel. As I began to compose few emails, the gentleman in next sitting space asked me what I do for living. Our conversation went like this.
Me: I run a software company
He: Oh, so you must be good with computers
Me: smiles and cringes at the stereotyping
He: What is the formula to select all the blank cells in my Excel data and highlight them in Yellow color
Mind you, he had no idea that I work in Excel. We were 2 random guys in airport lounge watching sports and eating miserable food.
Me: Well, what are you trying to do?
He: You see, I am auditing this data. I need to locate all the blank rows and set them in different color so that my staff can fill up missing information. Right now, I am selecting one row at a time and filling the colors. Is there a one step solution to this problem?
Needless to say, I showed him how to do it faster, which led to an interesting 3 hours at the lounge.
End of true story.
So today, let’s understand how to find & highlight all the blank cells in the data.
Continue »


