All articles with 'Microsoft Excel Formulas' Tag
Use “Playbill” font to make your incell charts realistic [quick-tips]
![Use “Playbill” font to make your incell charts realistic [quick-tips]](https://img.chandoo.org/c/use-playbill-font-incell-charts.png)
Most of you already know that using the REPT formula along with pipe (“|”) symbol, we can make simple in-cell charts in excel. For eg. =REPT(“|”,10) looks like a bar chart of width 10. Despite the simplicity, most people don’t use in-cell charts because these charts don’t look anything like their counterparts. But you can […]
Continue »
Today we will build a mortgage payment calculator (and amortization schedule) using excel. But we will not build a boring excel sheet, we will build a mortgage calculator that is easy to play with.
A mortgage payment is a monthly installment that you pay towards a loan. Any mortgage loan will typically have, (1) loan amount, (2) duration of the loan in years, (3) interest rate per year
Given these 3 parameters, we can easily determine the monthly installment amount (this will be the same amount for all months during loan tenure)
We are going to use Excel’s form controls (more on this below) to build a mortgage payment calculator like this.
Continue »Extract usernames from E-mail IDs [using LEFT and FIND formulas in Excel]
![Extract usernames from E-mail IDs [using LEFT and FIND formulas in Excel]](https://chandoo.org/img/f/username-from-email-id-excel-formula.png)
Today we will learn to use Excel’s LEFT and FIND formulas. But what fun it is to learn a new formula on a Tuesday? So, we will actually learn to use these formulas to solve the problem: “extract the username from an email ID” How is an email ID structured? Any email ID contains 2 […]
Continue »Product Recommendation – Excel Dashboard Training Kit

If you want to make better charts and create lasting impressions, chances are you have heard about Jorge Camoes. He writes at excelcharts.com (previously charts.jorgecamoes.com). I have been reading Jorge’s blog for over 2 years now and have linked to his excellent articles on PHD several times. Jorge also has an Excel Dashboard Training Kit, which teaches us how to make a dynamic and comprehensive excel dashboard. The dashboard training kit is a culmination most of his lessons implemented in a practical way using Excel.
In this article, I review the product and tell you why you should get a copy of it.
Continue »A New Year Resolutions Template that Kicks Ass

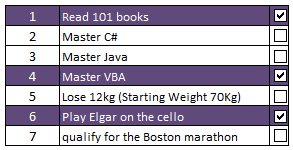
Jennie, a sweet and ambitious lady set out to do 101 things in the next 1001 days. She took the inspiration from Day Zero Project. Not stopping there, she prepared a cute little excel sheet to keep track of all these new year resolutions and sent it to me.
I think this is a swell excel template if you want to keep track of your goals or new year resolutions or just manage a list.
Continue »Highlighting Repeat Customers using Conditional Formatting [Part 2 of 2]
![Highlighting Repeat Customers using Conditional Formatting [Part 2 of 2]](https://chandoo.org/img/n/repeat-customers-excel-conditional-formatting.png)
This is second part of 2 part series on conditionally formatting dates in excel.
Highlighting Repeat Customers using Conditional FormattingIn yesterday’s post we have learned how to conditionally format dates using excel. In this article, you will learn how to use these conditional formatting tricks to highlight repeat customers in a list of sales records.
Continue »Conditionally Formatting Dates in Excel [Part 1 of 2]
![Conditionally Formatting Dates in Excel [Part 1 of 2]](https://chandoo.org/img/n/conditional-formatting-button.png)
This is first part of 2 part series on conditionally formatting dates in excel.
Conditional formatting is a very useful feature in Excel. You can use Conditional formatting to tell excel how to format cells that meet certain conditions. For eg. You can use conditional formatting to show all negative values in a range in red color. Today we will learn how to use conditional formatting to format dates.
Continue »Sales Dashboards – Visualizing Sales Data – 32 Dashboard Examples & Implementations

Sales reports and dashboards are very common in any company. There are several ways in which you can visualize sales data to understand the trends and sales performance. So in November, I have asked you to visualize sales data using sample data. The visualization challenge #2, sponsored by Zoho Reports generated a huge buzz around the community and fetched 32 incredible entries. The response was so overwhelming that it took me almost 24 hours to write this post. Thanks everyone for participating and making this a huge learning experience for everyone. Personally I have learned several useful dashboard and charting tricks. I will be sharing some of these lessons with all of you in the coming weeks.
Continue »How to Find Dates of Public Holidays using Excel

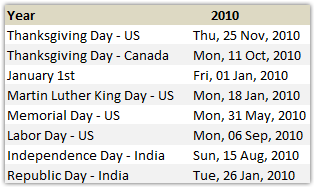
Lets celebrate these holidays in PHD Style. By learning few excel formulas that you can use to find out dates for some of the popular public holidays like – labor day, memorial day etc. When is Labor Day (US) in 2010? Labor day (the US variant) is celebrated on first Monday of every September. It […]
Continue »![2010 Calendar – Excel Template [Downloads]](https://chandoo.org/img/n/2010-calendar-thumb.png)
Here is a 2010 new year gift to all our readers – a free 2010 calendar excel file (a little secret: just change the year in “outline” sheet from 2010 to 2011, to get the next years calendar. It works all the way up to year 9999). You can even get a Printable PDF Calendar. There are 14 different sheets in the calendar file. First one is an outline calendar for the entire year. The next 12 are monthly calendars. And the last sheet shows a mini-calendar for the year 2010.
Read the rest of this post to know more and download the calendar.
Continue »![How to pick a random date? [Formulas]](https://chandoo.org/img/i/random-date-time.png)
Often when you need to generate a sample from large data set, you may want to pick data from a random date. In such cases, you can use excel’s RAND() and RANDBETWEEN() formulas to pick a random date. Here I have included few examples,
Continue »Christmas Gift List – Set your budget and track gifts using Excel

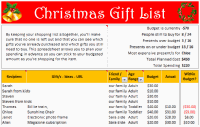
Steven, one of our readers from England sent me a Christmas gift tracker worksheet. I found it pretty cool, so made some minor changes to it and sharing it with you all so that you can have great time shopping for the holidays.
The workbook is full of lessons on conditional formatting, cell formatting, using formulas. Go ahead and download it today.
Continue »Findout Thanksgiving Day’s Date for Any Year [Excel Formulas]
![Findout Thanksgiving Day’s Date for Any Year [Excel Formulas]](https://chandoo.org/img/i/findout-thanksgiving-date.png)
Every year, on 4th Thursday of November, folks in US celebrate Thanksgiving day. A similar holiday exists in Canada too, they celebrate it on Second Monday of Every October.We will celebrate thanksgiving in PHD style, by sharing a wacky formula tip.
Today, we are going to learn how to use excel formulas to find out thanksgiving day’s date for any year.
Continue »Reverse a List using Formulas [Using Excel INDEX() Formula]
![Reverse a List using Formulas [Using Excel INDEX() Formula]](https://chandoo.org/img/l/reverse-list-in-excel.png)
Here is a simple yet novel use of formulas. Let us say you have a list of values in range A1:A5 and you want to reverse the list. In an empty cell write =INDEX($A$1:$A$5,6-ROWS($A$1:A1)) and copy down. Boom, you get the reversed list. Here is how the formula works: In the reversed list, first item […]
Continue »Top X chart – Show Top X values of a chart Interactively

Two charting principles we hear all the time are,
- Sort your data in a meaningful order before plotting it.
- Show only relevant information, not everything – because un-necessary information clutters the chart.
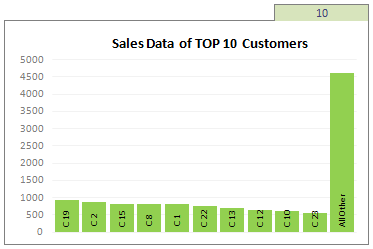
Today we will learn a dynamic charting technique that will mix these two ideas in a useful way. I call this a Top X chart.
Continue »

