All articles with 'Microsoft Excel Formulas' Tag
![2013 Calendar – Excel Template [Downloads]](https://img.chandoo.org/c/2013-calendar-template-FREE-download.png)
Here is a New year gift to all our readers – free 2013 Excel Calendar Template.
This calender has,
- One page full calendar with notes, in 4 different color schemes
- Daily event planner & tracker
- 1 Mini calendar
- Monthly calendar (prints to 12 pages)
- Works for any year, just change year in Full tab.
Can you find that pattern? [Homework]
![Can you find that pattern? [Homework]](https://img.chandoo.org/hw/can-you-find-that-pattern-excel-homework.png)
Are you ready for an Excel challenge?
Today, your job is very simple. Just find a pattern in a text and return corresponding value.
Your Homework:
In a range we have some resource types & their billing rates.
In another range, we have some descriptions. Each description contains a resource type somewhere inside it. We need to retrieve billing rate for each description by looking up which resource type is mentioned in it.
See above diagram.
Continue »Highlight best week & month in a trend chart [tutorials]
![Highlight best week & month in a trend chart [tutorials]](https://img.chandoo.org/c/highlight-best-week-month-in-trend-charts-excel-howtos.png)
When analyzing business data like sales, shop visits or productivity, one of the questions managers always ask is,
What is the best month / week for this data?
To answer this question, we need to make a chart that looks like above. Today, lets learn how to highlight portions of such charts that correspond to best week or best month.
Continue »Dressing Financial Statements – What Motivated Mr. Bean to Defraud Latte?
Did you know What Happened at Last Coffee Day?
Mr. Bean “dressed up” the financial statements and was caught in the fraud. But he was the CEO of Latte! So why did he commit fraud in his own company??
Any Guess?
Take a cappuccino and I will give you a hint – How was Mr. Bean’s Bonus to be decided?
Read on to know more…
Continue »How the tax burden has changed over the years – Excellent chart by NYTimes & Redoing it in Excel
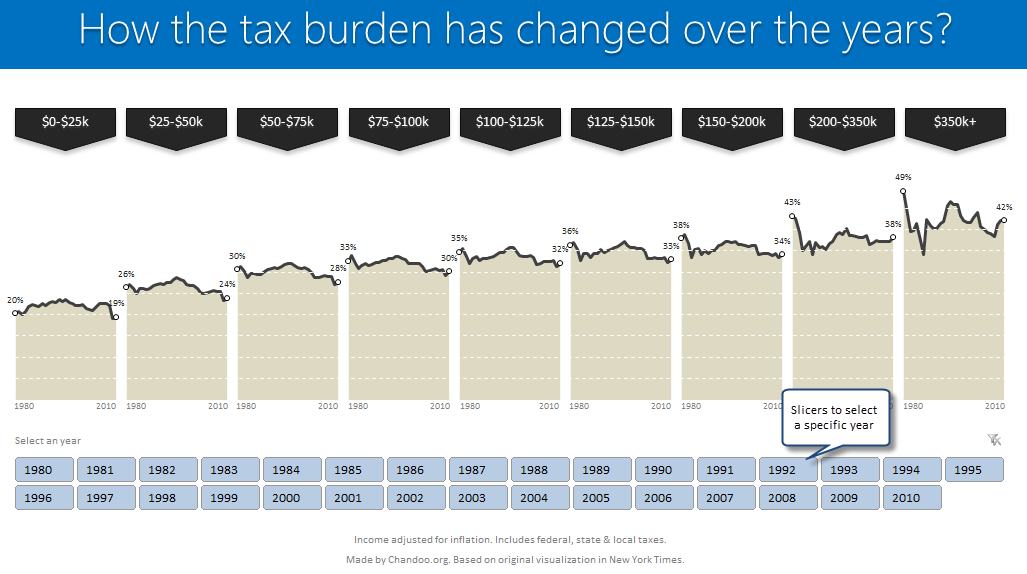
If I need some charting inspiration, I always visit New York Times. Their interactive visualizations are some of the best you can find anywhere. Clear, beautifully crafted and powerful. Long time readers of Chandoo.org knew that I like to learn from visualizations in NY Times & redo them using Excel.
Today let me present you one such chart. This is based on an interactive visualization prepared by NY Times explaining how the tax burden has changed over years for various income groups.
Take a look at tax burden chart – Excel implementation

Read on to learn how to create this chart using Excel.
Continue »![Project Portfolio Dashboard in Excel [Part 2 of 2]](https://img.chandoo.org/pm/project-portfolio-dashboard-small.png)
In this 2 part tutorial, we will learn how to design a project portfolio dashboard. Part 1 discussed user needs & design. Part 2 will show you Excel implementation.
Click here to get your copy.
Final Implementation – Project Portfolio Dashboard
First lets take a look at the finalized dashboard implementation. Continue reading to learn more & download this dashboard.
Continue »Write a formula to check if two dates are in same month? [homework]
![Write a formula to check if two dates are in same month? [homework]](https://img.chandoo.org/hw/check-two-dates-in-same-month-excel-homework.png)
Its Home work time folks. Sharpen your Excel pencils and get cracking.
Find out if 2 dates are in same month
Lets say you have 2 dates in A1, A2.
Q1. What formula tells us if both of them are in same month?
Both dates must be in same month & year!
Go ahead and post your answer in comments.
Continue »Extract file name from full path using formulas

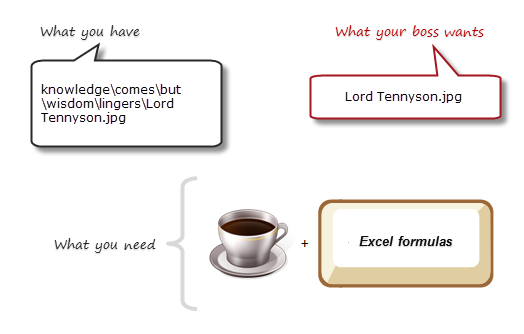
Today lets tackle a very familiar problem. You have a bunch of very long, complicated file names & paths. Your boss wants a list of files extracted from these paths, like below:
Of course nothing is impossible. You just need correct ingredients. I cannot help you with a strong cup of coffee, so go and get it. I will wait…
Back already? well, lets start the formula magic then.
Continue »![Check Cells for Equality – Follow Up [Quick Tip]](https://chandoo.org/wp/wp-content/uploads/2012/10/Equal.png)
Excel contains an often overlooked function
The Excel = Function
Today we quickly review what it can do for us.
Write a formula to check few cells have same value [homework]
Lets test your Excel skills. Can you write a formula to check few cells are equal?
Your homework:
- Let us say you have four values in cells A1, A2, A3, A4
- Write a formula to check if all 4 cells have same value (ie A1=A2=A3=A4)
- Your output can be TRUE/FALSE or 1/0 to indicate a match (or mis-match)

Your the production manager and have a need to schedule uneven resource across uneven requirements, how can you do that?
Well today we’ll look at Resource Allocation and Scheduling using Excel to do the hard work
Use Indexed charts when understanding change [Charting Techniques]
![Use Indexed charts when understanding change [Charting Techniques]](https://img.chandoo.org/c/example-indexed-chart-in-excel.png)
Today, lets talk about indexing, a technique used to compare changes in values over time.
What is indexing?
Lets say you want to compare prices of Gold & Coffee over last few years. Gold price in 2011 (oct) is $1,655 per ounce. And now (sept 2012) it is $1,744. Like wise, Silver price in 2011 is $32.06 and in 2012 it is $33.61. How do we compare such diverse numbers?
Enter indexing.
First we need to calculate price of Gold and Silver in 2012 assuming their starting price is 100. This can be done with simple arithmetic.
Now, we can easily compare the prices. Looking at the indexed prices, we can conclude that both Gold & Silver prices have gone up by similar percentage (~5%).
Continue »Formula Forensics No. 030 – Extracting a Sorted, Unique List, Grouped by Frequency of Occurrence

Today at Formula Forensics, Guest author Sajan shows us how to extract a sorted, unique list of items, displaying the most frequently occurring items first, while restricting the output based on some additional criteria.
Continue »18.2 Tips on Rounding numbers using Excel Formulas

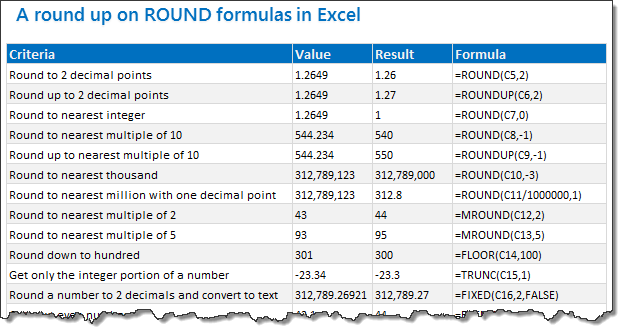
Lets talk round numbers today.I have 18.2 tips for you on round numbers.
We can use a variety of formulas to round numbers in Excel depending on the situation. We have ROUND, ROUNDUP, ROUNDDOWN, MROUND, INT, TRUNC, CEILING, FLOOR, FIXED, EVEN, ODD and few more. To know how to use all these formulas and how to round numbers based on any criteria, just read on.
Continue »
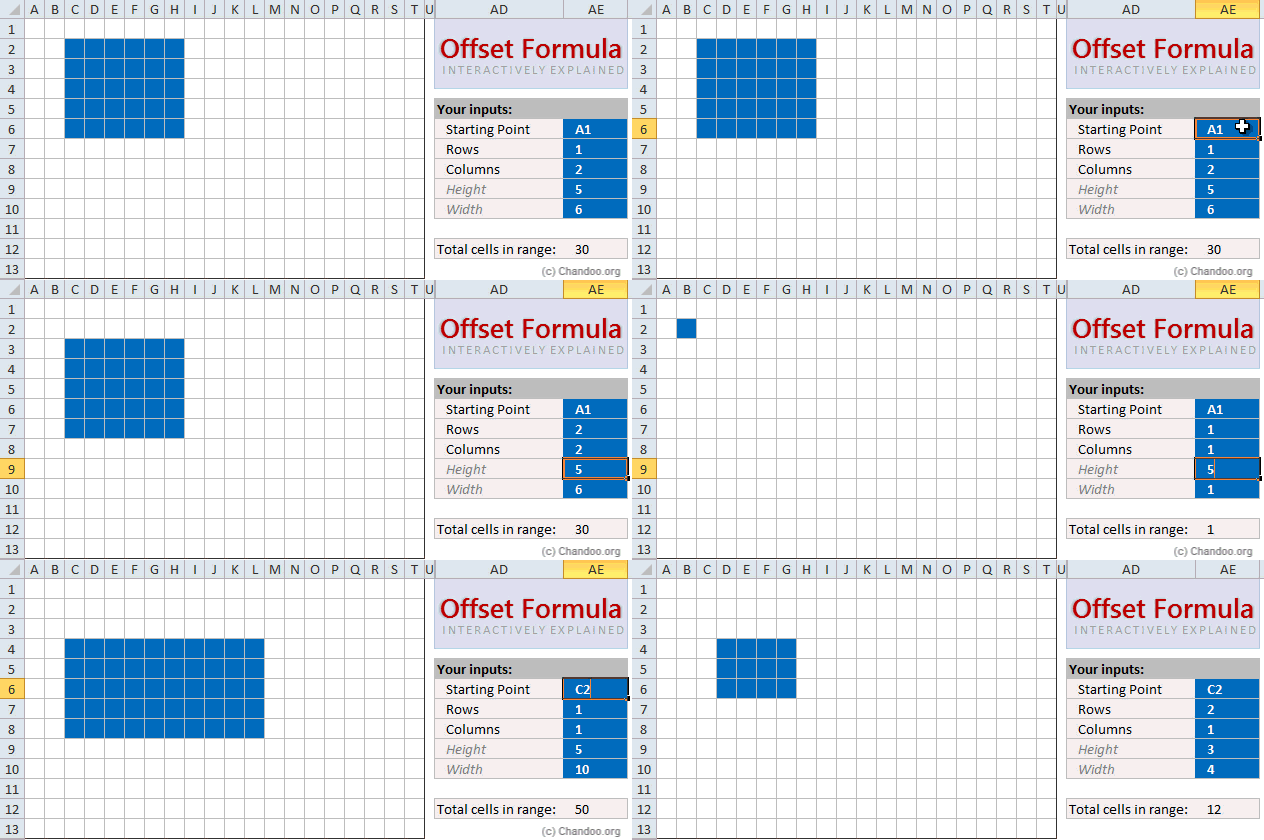
Today, lets learn OFFSET formula.
OFFSET formula gives us reference to a range, from a given starting point with given height and width in cells.
OFFSET formula syntax
OFFSET formula looks like this:
=OFFSET(starting point, rows to move, columns to move, height, width)
Starting point: This is a cell or range from which you want to offset
Rows & columns to move: How many rows & columns you want to move the starting point. Both of these can be positive, negative or zero. More on this below.
Height & width: This is the size of range you want to return. For ex. 4,3 would give you a range with 4 cells tall & 3 cells wide.
Read on…,
Continue »

