All articles with 'Microsoft Excel Formulas' Tag
5 Keyboard shortcuts for writing better formulas

As an analyst (or manager), I bet a good portion of your Excel time is spent writing formulas and getting the results.
So today, let us learn 5 important keyboard shortcuts that will save you a lot of time and help you write better formulas.
Continue »Here is a question someone asked me in a class recently.
“I know how to use VLOOKUP to find a value based on search term. But I have a slight variation to it. I need to extract value below the cell VLOOKUP finds.”
This is simpler than it sounds.
We can use INDEX + MATCH formulas to do this.
Continue »How to transpose a values in a row to column using formulas… [Quick tip]
![How to transpose a values in a row to column using formulas… [Quick tip]](https://img.chandoo.org/q/transpose-columns-to-rows-using-formulas.png)
This is interesting, I am in Columbus to meet one of my college friends. I remember him as a very meticulous person from college days. So it is no surprise when he showed me his massively impressive finance tracker last night. He has been tracking expenses, income, credit card payments and gas (petrol) consumption since 2008. Very impressive indeed.
Then out of blue he said, he has a problem with his spreadsheet. In this own words,
When entering data for credit cards, I use one column per card. But in my report view, I want to show credit card details in rows. How do I do this?
Something like above…. Today, lets learn how to do this using Excel formulas.
Continue »
Last week, we had a lovely poll on what are your favorite features of Excel? More than 120 people responded to it with various answers. So I did what any data analyst worth his salt would do,
I analyzed the data and here are the top 10 features in Excel according to you.
Read on to learn more.
Continue »![How to create interactive calendar to highlight events & appointments [Tutorial]](https://img.chandoo.org/vba/interactive-event-calendar-in-excel.png)
One of the popular uses of Excel is to maintain a list of events, appointments or other calendar related stuff. While Excel shines easily when you want to log this data, it has no quick way to visualize this information. But we can use little creativity, conditional formatting, few formulas & 3 lines of VBA code to create a slick, interactive calendar in Excel. Today, lets understand how to do this.
Continue »
Last week, we had our very first quiz – “How well do you know your LOOKUPs?”. I hope you have enjoyed it.
Today lets understand the answers & explanations for this quiz.
Continue »Unlock “Angy Formulas” – an Angry Birds like game hidden in Excel using this trick!!!
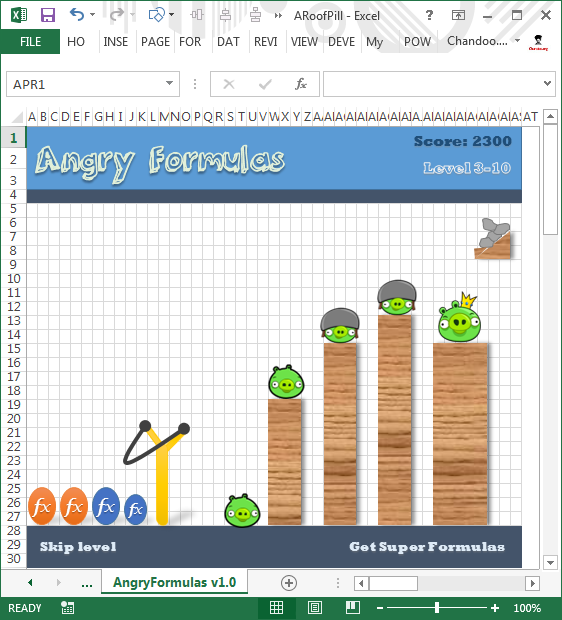
Sometimes you think you know something and then suddenly you are surprised. Yesterday was such a moment for me. I have been using Excel for almost a decade now. So naturally I assumed that I know it well. But then yesterday, while doing something I stumbled on a strange screen in Excel that looked like very popular Angry birds game. So I got searching. But there was no mention of it anywhere on net. Then I asked my friend Rollf ‘O’ Pai, who is in Micros0ft Execl team. First he denied such a thing. But we knew each other so well that he could never lie to me. So he confided. He told me what I had suspected for several years.
There is an Angry birds like video game buried in Excel!!! It was meant to be an Easter egg in Excel 2010 (and 2013), but due to backlash from senior management no one ever published the details about it.
So I asked him “How do I unlock it?”. Rollf ‘O’ Pai asked me to never reveal it to anyone and then told me the recipe.
Once I unlocked I could not believe how cool it is!
Read on to understand how to unlock this game.
Continue »Use Advances vs. Declines chart to understand change in values
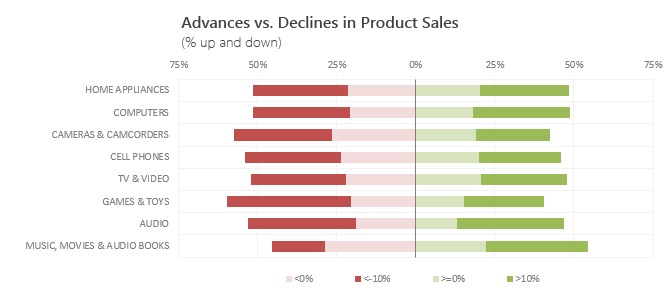
Lets say you are responsible for sales of 100s of products (which belong to handful of categories). You are looking at sales of each product in last month & this month. And you want to understand whether sales are improving or declining by category. How would you do it?
Turns out, this is not a difficult problem. In fact, this question is asked every day & answered using Advances vs. Declines chart.
You may have seen this chart in financial newspapers or websites. Shown above, Advances vs. Declines chart tells us how many items have advanced & how many have declined.
Read on to learn how to create this chart using Excel.
Continue »Transpose a table of data using Excel Formulas

Today lets tackle a familiar data clean-up problem using Excel – Transposing data.
That is, we want to take all rows in our data & make them columns. Something like this:
Learn these 4 techniques to transpose data:
1. Using Paste Special > Transpose
2. Using INDEX formula & Helper cells
3. Using INDEX, ROWS & COLUMNS formulas
4. Using TRANSPOSE Formula
Details about our Power Pivot Course [and a video for those of you not interested]
![Details about our Power Pivot Course [and a video for those of you not interested]](https://img.chandoo.org/power-pivot/power-pivot-course-details.png)
Hello folks,
If this article was a person, they would be schizophrenic. You see, it has 2 purposes:
- Give you all the details about my upcoming Power Pivot course
- Give you a solution to last week’s vacation days problem
Details about Power Pivot Course
Power Pivot, an Excel add-in makes it easy to connect, analyze & visualize massive amounts of data. This course aims to teach you how to use Power Pivot to analyze data, create advanced reports & prepare dashboards all from familiar interface of Excel. This is ideal for data analysts, reporting & MIS professionals, business analysts, managers & dashboard makers.
Can you calculate vacation days in a period? [Homework]
![Can you calculate vacation days in a period? [Homework]](https://img.chandoo.org/hw/calculate-vacation-days-excel-formula-homework.png)
Its Friday, that means time for another Excel challenge for you.
Calculate vacation days in a period:
Your mission, if you choose to accept it,
Step 1: Download the hom work problem file.
Step 2: Calculate number of vacations taken in a period. Specifically,
1) How many vacations are taken between start & end dates, assuming complete vacation should be inside the start & end date period?
2) How many vacations are taken such that at least one day of vacation is between start & end dates?
3) How many people took vacations? (if same person took multiple vacations, then count it as 1)
Designing a dashboard to track Employee vacations [case study]
![Designing a dashboard to track Employee vacations [case study]](https://chandoo.org/wp/wp-content/uploads/2013/01/employee-vacation-dashboard-full-view.png)
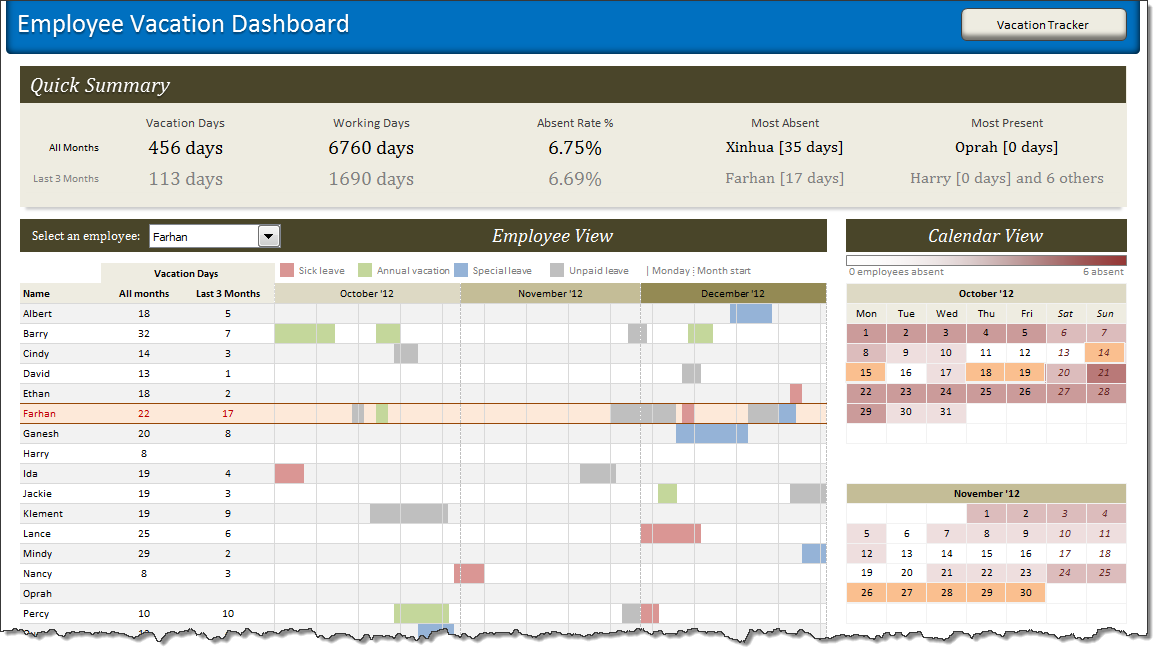
HR managers & department heads always ask, “So what is the vacation pattern of our employees? What is our average absent rate?”
Today lets tackle that question and learn how to create a dashboard to monitor employee vacations.
What do HR Managers need? (end user needs)
There are 2 aspects tracking vacations.
1. Data entry for vacations taken by employees
2. Status dashboard to summarize vacation data

Few weeks ago, someone asked me “What are the top 10 formulas?” That got me thinking.
While each of us have our own list of favorite, most frequently used formulas, there is no standard list of top 10 formulas for everyone. So, today let me attempt that.
If you want to become a data or business analyst then you must develop good understanding of Excel formulas & become fluent in them.
A good analyst should be familiar with below 10 formulas to begin with.
Continue »To-do List with Priorities using Excel
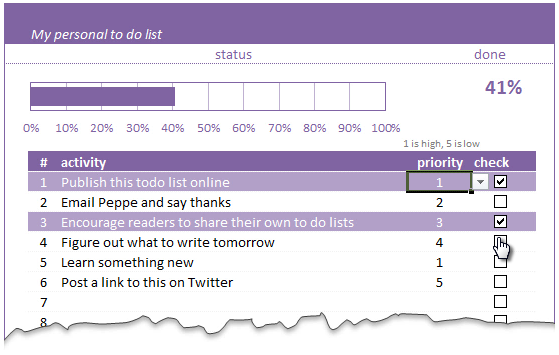
A while ago, we published a new year resolution template. This was a hit with our reader with thousands of you downloading it. During last week, Peppe, one of our readers from Italy, took this template and made it even more awesome.
The original template had tasks and completion check mark. As you finish each task, you can see the progress bar moving.
Peppe added priorities to this. With his new version, progress is measured based on how much priority we assigned that particular task. Pretty neat eh?!?
Continue »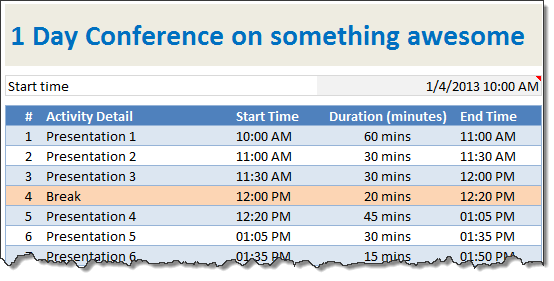
When planning a meeting, an event or activity, we deal with many individual steps (each taking certain amount of time). Today let us understand how to create an agenda template in Excel using simple formulas.
Continue »

