All articles with 'Learn Excel' Tag
{ 13 Comments }
Solve Sudoku Puzzles using Excel [because it is weekend]
Published on Oct 23, 2009 in VBA Macros
![Solve Sudoku Puzzles using Excel [because it is weekend]](https://chandoo.org/img/i/sudoku-solver-using-excel.png)
Sanjay, my colleague is an avid programmer and excel enthusiast. In his spare time he wrote a small VBA macro to solve Sudoku. Sudoku is a very famous number based puzzle with a 9×9 grid of cells. Each of the 9 rows, columns and 3×3 blocks should be filled in such a way that they have all the numbers from 1 to 9. Sudoku is a very effective way to keep your brain cells ticking. I am a huge sudoku fan and I solve sudoku whenever I have few minutes to kill. So naturally I jumped with joy when I saw Sanjay’s excel macro for solving sudoku. He is kind enough to let me share this with all of you.
Continue »{ 20 Comments }
How to get Excel 2003 Toolbars in Excel 2007 [productivity hack]
Published on Oct 19, 2009 in Excel Howtos
![How to get Excel 2003 Toolbars in Excel 2007 [productivity hack]](https://chandoo.org/img/p/customize-quick-access-toolbar-th.png)
In our recent poll, I have asked you to tell me which buttons you have on the quick access toolbar?
Finnur, one of our readers has configured the Excel 2007 quick access toolbar to make it look like Excel 2003 toolbar.
I think this is a very cool way to max up your productivity, it takes 5 minutes to make your quick access bar look like Excel 2003 toolbar and you could save countless hours of “searching-for-that-command-in-ribbon” time.
Continue »{ 103 Comments }
Making a chart with dynamic range of values
Published on Oct 15, 2009 in Charts and Graphs, Excel Howtos

We all know that to make a chart we must specify a range of values as input.
But what if our range is dynamic and keeps on growing or shrinking. You cant edit the chart input data ranges every time you add a row. Wouldn’t it be cool if the ranges were dynamic and charts get updated automatically when you add (or remove) rows?
Well, you can do it very easily using excel formulas and named ranges. It costs just $1 per each change. 😉
Ofcourse not, there are 2 ways to do this. One is to use Excel Tables and another is to use OFFSET formula.
Continue »
I have a super exciting news for all our members. During the last several weeks, I have been working on making 24 strikingly remarkable and easy to use excel templates for better project management. Finally the bundle is ready. You can get a copy of the bundle starting today.
Continue »{ 15 Comments }
Baby Feeding Chart using Excel
Published on Oct 12, 2009 in Charts and Graphs, Learn Excel

While feeding the babies last night, I had this idea. Why not make an excel sheet where you can keep track of the baby’s feeding and sleeping activities on day to day basis. It would probably help you understand your baby’s needs better and may be give you some insights.
Continue »{ 8 Comments }
Another Reason why Tables are so awesome [quick tip]
Published on Oct 8, 2009 in Excel Howtos
![Another Reason why Tables are so awesome [quick tip]](https://chandoo.org/img/l/excel-table-scroll-feature.png)
Ever since I have learned the tables feature in Excel 2007, I have fallen in love with that. They are so awesome and so user friendly.
Here is a simple, yet very effective feature of Excel Tables that will show table header row even when you scroll down. The header row is shown in the place of column headings (the place where you see A,B,C,D etc.).
Continue »![Project Management Dashboard / Project Status Report using Excel [Part 6 of 6]](https://chandoo.org/img/pm/project-status-dashboard-th.png)
Project management dashboards, project status reports help stakeholders, project sponsors and team-members can understand project status very quickly. In the last installment of project management using excel, learn how to make project management dashboard using excel in this tutorial. Also download the excel project status dashboard template.
Continue »{ 15 Comments }
Make a Bubble Chart in Excel [15 second tutorial]
Published on Oct 5, 2009 in Charts and Graphs, Excel Howtos
![Make a Bubble Chart in Excel [15 second tutorial]](https://chandoo.org/img/l/bubble-chart-excel-tutorial.png)
A Bubble chart displays circles (or bubbles) at given X and Y co-ordinates. Bubble chart is a very good way to show 3 dimensional data (for eg. Region-wise product sales) without confusing users. In this tutorial, we will learn how to create a bubble chart using excel.
Continue »{ 31 Comments }
What buttons you have in the excel quick access bar ? [weekend poll]
Published on Oct 2, 2009 in Learn Excel
![What buttons you have in the excel quick access bar ? [weekend poll]](https://chandoo.org/img/i/quick-access-bar-excel-2007.png)
This week’s poll is quite simple. Tell us what buttons/ icons you have added to the quick launch bar in excel 2007 (or toolbar in excel 2003)?
As for me, I have these in my home laptop’s excel:
Just use the comments and tell me about your settings.
Continue »{ 11 Comments }
Use Cell Styles to Make your Spreadsheet Models User-friendly [Quick Tip]
Published on Oct 1, 2009 in Excel Howtos, Learn Excel
![Use Cell Styles to Make your Spreadsheet Models User-friendly [Quick Tip]](https://chandoo.org/img/i/use-excel-cell-styles.png)
Spreadsheet modeling or scenario modeling is one of the common uses of Microsoft Excel. People, especially in financial sector use MS Excel to do a lot of modeling. While excel has such powerful features like goal seek and scenarios, it also has a very useful feature called “cell styles” that you can exploit to make […]
Continue »{ 25 Comments }
Recipe for a Donut Bar Chart
Published on Sep 30, 2009 in Charts and Graphs, Learn Excel
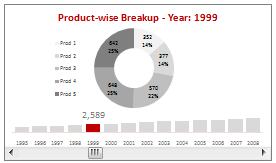
We all know that bar charts can be used to display values spread across various categories or times and pie charts / donut charts can be used to display percentage breakup of various quantities in a sum total. How about mashing up both to create a Donut Bar chart?
In this tutorial, you can learn how to make a donut bar chart and linking it to a form control to display Product-wise sales breakups spread across several years.
Continue »{ 6 Comments }
5 Things you probably dont know about this site
Published on Sep 28, 2009 in blogging, Learn Excel
Hello there new reader, do you know these 5 things about Pointy Haired Dilbert? Curious? read the rest of the article to know more.
Continue »{ 6 Comments }
Twins, Clones and Duplicates – 6 Excel Shortcuts from an Excited Dad
Published on Sep 25, 2009 in Charts and Graphs, Learn Excel

I could barely sleep last night. Even though I came home, my heart was in that hospital room only. I got up at 5:30, and came to see my wife and kids by 7:30. Now that they all are sleeping, I can quickly whip an excel post, to help you make twins, clones and duplicates.
Continue »{ 41 Comments }
Calculate Elapsed Time in Excel [Quick Tips]
Published on Sep 22, 2009 in Excel Howtos, Learn Excel
![Calculate Elapsed Time in Excel [Quick Tips]](https://chandoo.org/img/n/elapsed-time-in-excel-th.png)
Calculating elapsed time is very common whether you are managing a project or raising a baby. Elapsed time is nothing but interval between a starting point and the current point in time. We can use excel formulas to calculate elapsed time very easily. In this post, learn how to calculate elapsed time in days, working days, hours, weeks, months, years, minutes and seconds.
Continue »{ 12 Comments }
7 ideas Excel can pick-up from iWork Numbers
Published on Sep 21, 2009 in Charts and Graphs, Learn Excel

We have a macbook at home. Like all latest macbooks, this one too came with a trail version of iWork. Even though I have used iWork before, this time I wanted to compare iWork numbers with Excel. In this post, I want to highlight 7 really cool features for iWork and how Microsoft excel can benefit from implementing the same.
Continue »
