All articles with 'Learn Excel' Tag
Keen readers of Chandoo.org would have noticed a slow down in new posts recently. There are a few reasons for that.
- I went to Malaysia to conduct Excel Dashboards & Power Pivot masterclass.
- After coming back, we (our family) went to Goa to vacation for a few days.
- When we got back, we all fell in to a vicious loop of flu, body pains and fatigue.
- And it took a few days to recover and fall back in to routine.
- But the most important reason is, I am writing a book 🙂
Introducing The Vlookup Book
Friends, readers & supporters of Chandoo.org,
I am very glad to announce my newest book – the vlookup book to help you become awesome in answering any lookup related question.
Continue »
Today, let’s travel in time. Pack your photon ray guns, extra underwear, buckle your seat belts and open Excel!
Of course, we are not going to travel in time. (Come to think of it, we are going to travel in time. By the time you finish reading this, you would have traveled a few minutes)
We are going to learn how to travel in time when using Excel. In simple terms, you are going to learn how to move forward or backward in time using Excel formulas.
So are you ready to hit the warp speed? Let’s beam up our Excel time machine.
Continue »Howdy again, folks. Jeff Weir here, borrowing the keys to the blog off Chandoo again. (Hopefully I don’t scratch it again). How remiss of me…jacob reminded me in the comments of my previous BLOATED post on good spreadsheet anti-bloat practices that I completely missed one of Excel’s newest and most efficient anti-bloat features: PowerPivot. So […]
Continue »What are best Excel interview questions? [survey]
Hello folks…
Time for a fun & useful survey. This time lets talk about Excel Interview Questions.
Many of you are silently becoming awesome in Excel, data analysis, charting, dashboard reporting, VBA, Power Pivot and business skills, thanks to all the time you spend on Chandoo.org. I am sure there will be a day in near future, when you have to face another interview and be selected for a challenging, fun & high paying role.
Likewise, there is also a significant portion of you who are too good in your job that you will become a senior manager, VP or CXO, or better still start your own business. When the tables have turned, you will be the one looking for smart, dedicated, talented and fun individuals to join your team and make you look even more awesome.
So my question for both prospective interviewees and wannabe Excel pros,
According to you, what are the best Excel interview questions?
Continue »7 reasons why you should use INDEX() formula in Excel

Today lets get cozy. Lets start a fling (a very long one). Lets do something that will make you smart, happy and relaxed.
Don’t get any naughty ideas. I am talking about INDEX() formula.
INDEX?!?
Of all the hundreds of formulas & thousands of features in Excel, INDEX() would rank somewhere in the top 5 for me. It is a versatile, powerful, simple & smart formula. Although it looks plain, it can make huge changes to the way you analyze data, calculate numbers and present them. It is so important that, whenever I teach (live or online), I usually dedicate 25% of teaching time to INDEX().
Enough build up. Lets get cozy with INDEX.
Continue »Calculating average of every nth value [Formula tips]
![Calculating average of every nth value [Formula tips]](https://img.chandoo.org/f/average-of-every-nth-value-excel-formulas.png)
Lets say you have a large list of numbers, and you want to calculate the average of every nth value. Not the average of all numbers, but just every nth number.
That is what we will learn in next few minutes.
Continue »![How to find the lowest value? [Quick tip]](https://img.chandoo.org/q/finding-lowest-value.png)
Lets say you are the head of purchasing department at Big Corp Co.
You are obviously very busy. Every day starting with a large cup of coffee and ends with a big smile, as you save your company thousands of $s by negotiating best deals, finding best providers and being awesome.
Today, let me share a small Excel tip with you that will make you even more awesome.
Continue »Details about upcoming Power Pivot course (and a bonus tip on dashboards)

Hello friends..,
I have 2 things for you:
- Details about our upcoming Power Pivot courses
- A short video about designing better dashboards.

Hi there,
I have a question and an announcement for you.
Question: Are you interested in learning Power Pivot? Do you want to connect, analyze and visualize lots of data using Excel?
IF(Your_answer="YES", "Read Announcement", "Read Announcement anyway!")
Announcement: 2nd Batch of Power Pivot coming on August 1st.
Continue »Never use simple numbers in your dashboards (bonus tip: how to fix default conditional formatting)

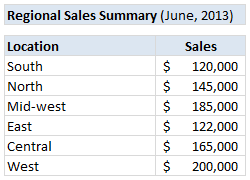
Pop quiz: What is wrong with above report?
At first glance, it looks alright. But if you observe closely, you realize that it is not telling the entire story. Just looking at regional sales numbers, you have not much clue what is going on with them.
So how to improve it?
Continue »How to use Excel Data Model & Relationships

Have you ever been in a VLOOKUP hell?
Its what happens when you have to write a lot of vlookup formulas before you can start analyzing your data. Every day, millions of analysts and managers enter VLOOKUP hell and suffer. They connect table 1 with table 2 so that all the data needed for making that pivot report is on one place. If you are one of those, then you are going to love Excel 2013’s data model & relationships feature.
Continue »5 Keyboard shortcuts for writing better formulas

As an analyst (or manager), I bet a good portion of your Excel time is spent writing formulas and getting the results.
So today, let us learn 5 important keyboard shortcuts that will save you a lot of time and help you write better formulas.
Continue »Ever seen a formula like =SUMIFS(Sheet1!B2:B3923, Sheet1!C2:C3923, A1, Sheet1!D2:D3923, A2) and wondered what it is really doing?!?
If so, you are not alone.
Formulas written with cell references tend to look complicated and clunky. What if we could write formulas in plain English?
That is what Structural References do. When using structural references in formulas, your focus will be on your data, not on which cell ranges the data takes up.
For example, you can write formulas like these:
1) SUM(mySales[no. of customers]) to find how many customers we had.
2) SUMIFS(mySales[no. of customers], mySales[product], “FastCar”) to find how many customers bought “FastCar”
Here is a question someone asked me in a class recently.
“I know how to use VLOOKUP to find a value based on search term. But I have a slight variation to it. I need to extract value below the cell VLOOKUP finds.”
This is simpler than it sounds.
We can use INDEX + MATCH formulas to do this.
Continue »


