All articles with 'downloads' Tag
{ 15 Comments }
Christmas Gift List – Set your budget and track gifts using Excel
Published on Dec 7, 2009 in excel apps, Learn Excel
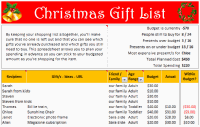
Steven, one of our readers from England sent me a Christmas gift tracker worksheet. I found it pretty cool, so made some minor changes to it and sharing it with you all so that you can have great time shopping for the holidays.
The workbook is full of lessons on conditional formatting, cell formatting, using formulas. Go ahead and download it today.
Continue »{ 16 Comments }
Use Shapes and Images to make Prettier Charts [Dashboard Tricks]
Published on Dec 3, 2009 in Charts and Graphs
![Use Shapes and Images to make Prettier Charts [Dashboard Tricks]](https://chandoo.org/img/c/use-shapes-to-make-better-dashboard-charts.png)
One of the annoyances of charts is that they all look like boxes (except for pie charts, they just look wrong). Boxes might be ok when you are making 1 or 2 charts. But a whole dashboard of boxes can look little rigid. So how can we make the charts peppy without loosing any effect? Like these charts below:
Very simple, we use drawing shapes in MS Excel to draw whatever we want and overlay the chart on top.
Continue »![Personal Budget Spreadsheet [Downloads]](https://chandoo.org/wp/wp-content/uploads/2009/11/household-budget-spreadsheet-th.png)
At PHD household, we believe in using money wisely. Both Mrs. PHD and I come from very modest backgrounds. Our upbringing has taught us value of money in the most effective way – by exposing us to not having any. So when we got our first job (did I tell you that both Jo and I started working in same company and sat in same floor? Oh, it was such a lovely time), we were very prudent and decided not to waste money on anything trivial (we still are, just that over last 6 years our earning capacity increased a bit and we became parents).
Anyways, I am not here to bore you about my household. But I am here to tell you fun ways to track expenses and household budgets using spreadsheets.
Continue »{ 7 Comments }
Download Excel 2010 Beta today [Office 2010 Updates]
Published on Nov 18, 2009 in Learn Excel
![Download Excel 2010 Beta today [Office 2010 Updates]](https://chandoo.org/img/l/office-2010-excel-download.png)
Finally the public beta of Office 2010 is out. Go to Office Beta site and download the installation today. Make sure you select the “custom” installation option and choose to “keep the old versions”, otherwise the beta will upgrade your office installation. (Beta installation expires by October 2010) Here is a brief list of new […]
Continue »{ 24 Comments }
Top X chart – Show Top X values of a chart Interactively
Published on Nov 12, 2009 in Charts and Graphs, Learn Excel
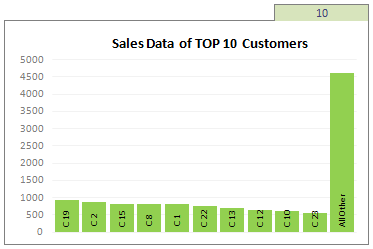
Two charting principles we hear all the time are,
- Sort your data in a meaningful order before plotting it.
- Show only relevant information, not everything – because un-necessary information clutters the chart.
Today we will learn a dynamic charting technique that will mix these two ideas in a useful way. I call this a Top X chart.
Continue »
Yesterday I read about interaction plots on junk charts where he points out the merits of an interaction plot. Interaction plots show interaction effects between 2 factors. For eg. you can show how your product sales have changed between year 1 and year 2 using an interaction plot like the one shown aside.
Continue »{ 7 Comments }
Project Dashboard + Tweetboard = pure awesomeness!!!
Published on Oct 27, 2009 in Charts and Graphs
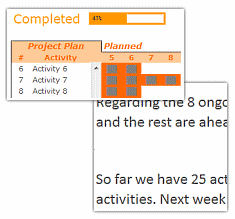
Check out an implementation of project dashboard along with tweetboard by our reader Fernando. He says, it “turned out to be a great success”. I am so happy for him.
Btw, the post includes a link to download the workbook so that you can see the dashboard and tweetboard in action.
Continue »{ 13 Comments }
Solve Sudoku Puzzles using Excel [because it is weekend]
Published on Oct 23, 2009 in VBA Macros
![Solve Sudoku Puzzles using Excel [because it is weekend]](https://chandoo.org/img/i/sudoku-solver-using-excel.png)
Sanjay, my colleague is an avid programmer and excel enthusiast. In his spare time he wrote a small VBA macro to solve Sudoku. Sudoku is a very famous number based puzzle with a 9×9 grid of cells. Each of the 9 rows, columns and 3×3 blocks should be filled in such a way that they have all the numbers from 1 to 9. Sudoku is a very effective way to keep your brain cells ticking. I am a huge sudoku fan and I solve sudoku whenever I have few minutes to kill. So naturally I jumped with joy when I saw Sanjay’s excel macro for solving sudoku. He is kind enough to let me share this with all of you.
Continue »{ 103 Comments }
Making a chart with dynamic range of values
Published on Oct 15, 2009 in Charts and Graphs, Excel Howtos

We all know that to make a chart we must specify a range of values as input.
But what if our range is dynamic and keeps on growing or shrinking. You cant edit the chart input data ranges every time you add a row. Wouldn’t it be cool if the ranges were dynamic and charts get updated automatically when you add (or remove) rows?
Well, you can do it very easily using excel formulas and named ranges. It costs just $1 per each change. 😉
Ofcourse not, there are 2 ways to do this. One is to use Excel Tables and another is to use OFFSET formula.
Continue »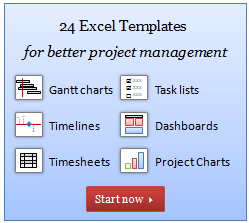
I have a super exciting news for all our members. During the last several weeks, I have been working on making 24 strikingly remarkable and easy to use excel templates for better project management. Finally the bundle is ready. You can get a copy of the bundle starting today.
Continue »{ 15 Comments }
Baby Feeding Chart using Excel
Published on Oct 12, 2009 in Charts and Graphs, Learn Excel

While feeding the babies last night, I had this idea. Why not make an excel sheet where you can keep track of the baby’s feeding and sleeping activities on day to day basis. It would probably help you understand your baby’s needs better and may be give you some insights.
Continue »![Project Management Dashboard / Project Status Report using Excel [Part 6 of 6]](https://chandoo.org/img/pm/project-status-dashboard-th.png)
Project management dashboards, project status reports help stakeholders, project sponsors and team-members can understand project status very quickly. In the last installment of project management using excel, learn how to make project management dashboard using excel in this tutorial. Also download the excel project status dashboard template.
Continue »{ 25 Comments }
Recipe for a Donut Bar Chart
Published on Sep 30, 2009 in Charts and Graphs, Learn Excel
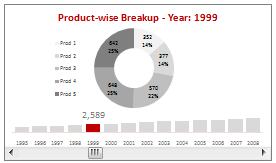
We all know that bar charts can be used to display values spread across various categories or times and pie charts / donut charts can be used to display percentage breakup of various quantities in a sum total. How about mashing up both to create a Donut Bar chart?
In this tutorial, you can learn how to make a donut bar chart and linking it to a form control to display Product-wise sales breakups spread across several years.
Continue »{ 41 Comments }
Calculate Elapsed Time in Excel [Quick Tips]
Published on Sep 22, 2009 in Excel Howtos, Learn Excel
![Calculate Elapsed Time in Excel [Quick Tips]](https://chandoo.org/img/n/elapsed-time-in-excel-th.png)
Calculating elapsed time is very common whether you are managing a project or raising a baby. Elapsed time is nothing but interval between a starting point and the current point in time. We can use excel formulas to calculate elapsed time very easily. In this post, learn how to calculate elapsed time in days, working days, hours, weeks, months, years, minutes and seconds.
Continue »{ 22 Comments }
Master Excel 2007 Ribbon with this Free Learning Guide
Published on Sep 17, 2009 in Featured, Learn Excel
Over the last few years, there has been much debate about the merits and perils of Microsoft Ribbon UI in Excel 2007. Personally I think ribbon is a good way to explore an application. I have gotten used to it since I tested excel 2007 for first time. Now, during the rare occasions I work […]
Continue »
