All articles with 'downloads' Tag
{ 26 Comments }
FIFA Worldcup Excel Spreadsheets [Roundup]
Published on Jun 11, 2010 in Charts and Graphs, excel links
Looking for FIFA World cup 2018 Tracker? Click here. Today FIFA World-cup 2010 is beginning. For the next 30 days or so, no matter where you go, you are bound to hear about soccer, world cup, teams, points, goals and what not. As a tribute to this beautiful and lovely sport, I want to showcase […]
Continue »{ 5 Comments }
6 things you should know about Excel School
Published on Jun 10, 2010 in Learn Excel, products

As most of you would know, I am re-opening Excel School Online Excel Training Program on June 14th. That means, I am very busy doing behind the scenes work so that new students get best possible excel learning experience when they come rushing next week. (That is why you are seeing less no. of posts on Chandoo.org this week).
But I have few last minute surprises for you. Just read on if you are interested to learn excel and become even more awesome.
Continue »
While I was working Denmark, there is one thing I noticed. Danes are one hell of football lovers. The football (soccer) enthusiasm is over the top when there is a match between Denmark and Sweden. A common practice in many offices is a football pool. This is how it works: When there is a match […]
Continue »{ 207 Comments }
Get Stock Quotes using Excel Macros [and a Crash Course in VBA]
Published on Jun 2, 2010 in Learn Excel, VBA Macros
![Get Stock Quotes using Excel Macros [and a Crash Course in VBA]](https://img.chandoo.org/vba/stock-quotes-in-excel-macro.png)
Have you ever wanted to fetch live stock quotes from excel? In this post we will learn about how to get stock quotes for specified symbols using macros. We use Yahoo! Finance API to fetch the stock quotes and other information related to a company using excel macros. Along the way, we will also learn various interesting things about Excel VBA. Think of this post as a crash course in VBA.
This is a guest post by Daniel Ferry.
Continue »{ 9 Comments }
Official FIFA World-cup Soccer Balls since 1930 in an Excel Chart [Excel Fun]
Published on May 28, 2010 in Charts and Graphs
![Official FIFA World-cup Soccer Balls since 1930 in an Excel Chart [Excel Fun]](https://chandoo.org/img/vp/official-fifa-worldcup-soccer-balls-from-1930.png)
The FIFA World-cup 2010 edition is around the corner. Like millions of people around the world, I too am an ardent fan of football. (although, I have played only one game of soccer in which I waited near opponents goal post as I was too lazy to run around. And when my team mates kicked […]
Continue »{ 12 Comments }
Dynamic Dashboard in Excel – Pulling it all together [Part 4 of 4]
Published on May 26, 2010 in Charts and Graphs, VBA Macros
![Dynamic Dashboard in Excel – Pulling it all together [Part 4 of 4]](https://chandoo.org/img/ed/excel-dynamic-dashboard-final-th.png)
In the last installment of our dynamic dashboard tutorial, we will take all that we have learned in first 3 parts and combine that to create a final dashboard. We are going to use concepts like table of contents, macros and data validation to help us get ahead. You can find the entire macro and downloadable workbook inside the post. Read on…
Continue »{ 7 Comments }
Evolution of Privacy Policies on Facebook – a Panel Chart in Excel
Published on May 13, 2010 in Charts and Graphs, Cool Infographics & Data Visualizations

Out of curiosity I took the data from Matt McKeon’s Privacy on Facebook chart and try to re-do the chart in Excel. I made a panel chart depicting how Facebook’s privacy policies have changed since 2005. You can see a bigger version of chart as well as get the download excel from the post. Read on…
Continue »{ 32 Comments }
Introduction to Panel Charts using Excel – Tutorial & Template
Published on May 12, 2010 in Charts and Graphs, Featured
In this article we will learn what a Panel Chart is and how you can construct a panel chart in Excel.
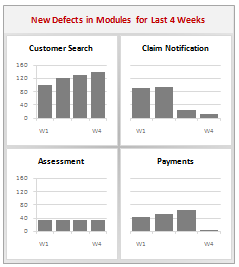
What is a Panel Chart?
A panel chart is a set of similar charts neatly aligned in panels to help us understand some data which has multiple variables in it. Panel charts are also called by names “trellis displays” or “small multiples”. They are an effective way to display multi-variable data.
Here is an example panel chart showing the total defects per module over the last 4 weeks.
Continue »{ 19 Comments }
Exclude Hidden Rows from Totals [How to?]
Published on May 11, 2010 in Excel Howtos, Learn Excel
![Exclude Hidden Rows from Totals [How to?]](https://chandoo.org/img/f/find-a-row-is-hidden-or-not-subtotal-formula.png)
Denice, an Excel School student emailed me an interesting problem. I have a bunch of data from which I want to find the sum of values that meet a criteria. But I also want to exclude any rows that are hidden. Well, we know how to find sum of values that meet a criteria – […]
Continue »{ 205 Comments }
Data Tables & Monte Carlo Simulations in Excel – A Comprehensive Guide
Published on May 6, 2010 in All Time Hits, Analytics, Charts and Graphs, Excel Howtos, Featured, Huis, Learn Excel, Posts by Hui, simulation

If anybody asks me what is the best function in excel I am drawn between Sumproduct and Data Tables, Both make handling large amounts of data a breeze, the only thing missing is the Spandex Pants and Red Cape!
How often have you thought of or been asked “I’d like to know what our profit would be for a number of values of an input variable” or “Can I have a graph of Profit vs Cost”
This post is going to detail the use of the Data Table function within Excel, which can help you answer that question and then so so much more.
Continue »{ 8 Comments }
How to Get “Either-Or” Condition in Data Validation?
Published on May 4, 2010 in Learn Excel
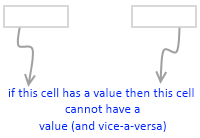
In a recent consulting assignment I had a tricky data validation problem. The customer wanted to have an either-or condition in the data validation, like this: My initial reaction to this requirement was “hmm… that is not possible“. But before shooting the email back to client, I got curious and checked if excel data validation […]
Continue »{ 5 Comments }
Quarterly totals when you have multi-year data [SUMPRODUCT again]
Published on Apr 30, 2010 in Excel Howtos, Learn Excel
![Quarterly totals when you have multi-year data [SUMPRODUCT again]](https://img.chandoo.org/f/quarterly-totals-multi-year-data.png)
In yesterdays post – Find Quarterly Totals from Monthly Data, we have learned how to use SUMPRODUCT formula to find totals by Quarter from a set of monthly values. The approach is fine, but has one glaring draw back. It only works when you have data for one year. In that post, Martin said, … […]
Continue »{ 34 Comments }
Find Quarterly Totals from Monthly Data [SUMPRODUCT Formula]
Published on Apr 29, 2010 in Excel Howtos, Learn Excel
![Find Quarterly Totals from Monthly Data [SUMPRODUCT Formula]](https://img.chandoo.org/f/quarterly-totals-from-monthly-data.png)
Here is a problem we face very frequently. You have a list of values by months. And you want to find out the totals by Quarter. How do you go about it? There are 2 options: You can make a pivot report from the data and then group dates in that to find totals by […]
Continue »{ 20 Comments }
What are your favorite colors for charts?
Published on Apr 23, 2010 in Charts and Graphs
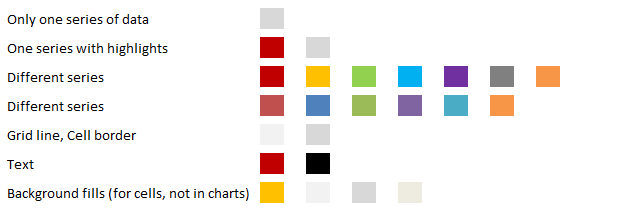
Ok, it is Friday again. That means poll time. I would like to know what color choices you prefer for your charts?
My Favorite Colors for Charting are,
These are the colors I use when making charts in Excel 2007 (it has capability to set any color for chart elements).
Continue »{ 6 Comments }
Making a Dynamic Dashboard in Excel [Part 3 of 4]
Published on Apr 22, 2010 in Charts and Graphs, VBA Macros
![Making a Dynamic Dashboard in Excel [Part 3 of 4]](https://chandoo.org/img/ed/moving-objects-with-vba.gif)
In this post we are going to look at a simple example of the VBA behind the Dynamic Dashboard. Essentially we will learn to write macros for doing this. Read the rest of this post to find code samples and downloadable files to play with.
Continue »
