All articles with 'downloads' Tag
How to make a Birthday Reminder in Excel ? [Video]
Learn how to create a birthday reminder worksheet in excel in this video post. You can also download a template to keep track of upcoming birthdays and anniversaries.
Continue »Analyze Competition with Scatter Plots – A business chart example

Analyzing competition is one of the key aspects of running a business. In this article, learn how to use Excel’s scatter plots to understand competition, like shown aside.
The inspiration for this comes from a recent article on Asymco analyzing mobile handset market (Apple iPhone, Nokia etc.) and how it has changed since 2007.
Read the rest of the post to learn how to create this type of chart in excel. Also, you can download the chart template. Go ahead.
Continue »FREE Excel Financial Model for Analyzing an IPO – Download Today
Lets keep this quick and short, As some of you may know, There is a mega IPO (initial public offering) going on in India these days. It is for a company called Coal India Ltd. So my partners at Pristine Education thought, it would be cool to build a financial model analyzing the IPO. Click […]
Continue »Finding 2nd Largest Item in a List that meets a Criteria [Excel Array Formulas]
![Finding 2nd Largest Item in a List that meets a Criteria [Excel Array Formulas]](https://img.chandoo.org/f/2nd-largest-sale-item-array-formula.png)
Excel Array Formulas have subtle beauty and raw power. Today I want to share how you can use Excel Array Formulas to find-out the 2nd largest sale amount corresponding to a particular product.
Lets say you have sales data like this:
Now, we all know that, to get 2nd largest sale amount, we can use the LARGE() formula. Like this: =LARGE(RANGE,2)
But, how do we know what is the 2nd largest sale amount for the product “bricks”?
Continue »Excel School Closing in a Few Hours – Join Now!

As some of you know, I run an online Excel Training Program called as Excel School. I have opened registrations for 3rd batch of this program on September 14th. Thank you very much for supporting this program wildly. In a few hours, I will be closing the registrations for Excel School.
Click here to sign up for Excel School
Read the rest of the post to learn more about Excel School and also download time across world chart template.
Continue »Show Zebra Lines when Value Changes [Excel Conditional Formatting Homework]
![Show Zebra Lines when Value Changes [Excel Conditional Formatting Homework]](https://chandoo.org/img/hw/zebra-lines-when-value-changes-excel-conditional-formatting.png)
Here is a quick home work on excel conditional formatting. Lets say you have data as shown below to left and you need to show zebra lines whenever the value changes (see right). Your home work is simple. Just figure out how to write conditional formatting rules to add zebra lines. The data set is […]
Continue »
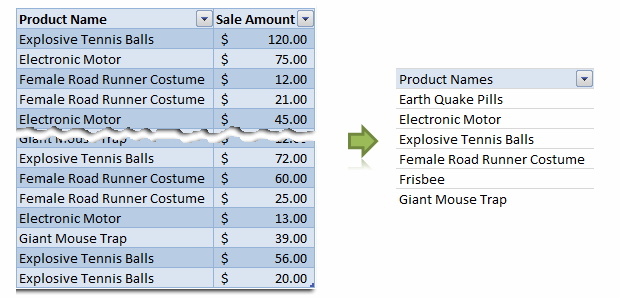
Removing duplicate data is like morning coffee for us, data analysts. Our day must start with it. It is no wonder that I have written extensively about it (here: 1, 2, 3, 4, 5, 6, 7, 8). But today I want to show you a technique I have been using to dynamically extract and sort […]
Continue »Displaying & Selecting a Scenario using VBA [Modeling in Excel]
![Displaying & Selecting a Scenario using VBA [Modeling in Excel]](https://chandoo.org/img/vba/excel-scenario-selection-demo.gif)
If you are building financial models or any other type of excel based decision models, chances are, there will be multiple scenarios in your model. Whenever you have multiple scenarios, you may want an easy, intuitive way to select one of them. In this post, I will present an interesting scenario display & selection technique that I received by email from our reader Itay Maor.
Continue »Putting it all together – Final Project Evaluation Model [Part 6 of 6]
This is a guest post written by Paramdeep from Pristine. Chandoo.org is partnering with Pristine to bring an excel financial modeling online training program for you. This is Part 6 of 6 on Financial Modeling using Excel In this tutorial we are going to learn how to build assumptions & input sheets in our excel […]
Continue »Make your data validations dynamic! [quick tip]
![Make your data validations dynamic! [quick tip]](https://chandoo.org/img/q/dynamic-data-validation-demo.gif)
Ok, since excel school 3rd batch is going to open on 15th, I wasnt going to write anything today. I have slept just 4 hours last night, blame it on work (and that funny video on youtube). But I found 30 minutes free time, so here you go, a quick but delicious tip on making your data validation dynamic.
Dynamic Data Validation?!? What in the name of slice bread and peanut butter is that?
See the demo aside to understand and read on to master the trick.
Continue »How to Calculate Working Hours Between 2 Dates [Solution]
![How to Calculate Working Hours Between 2 Dates [Solution]](https://img.chandoo.org/hw/lumbergh-with-poor-johnny.jpg)
This post builds on earlier discussion, How many hours did Johnny work? I recommend you to read that post too. Lets say you have 2 dates (with time) in cells A1 and A2 indicating starting and ending timestamps of an activity. And you want to calculate how many workings hours the task took. Further, lets […]
Continue »10 things you should know about Excel School

This post is about my Excel School online training program. Feel free to skip if you are looking for excel tips. Some of you know that I run an online Excel training program called Excel School. It helps excel newbies and beginners to learn about various powerful features and become proficient in them. We discuss […]
Continue »Modeling & Building Cash-flow Projections for Project Valuation [Part 4,5 of 6]
![Modeling & Building Cash-flow Projections for Project Valuation [Part 4,5 of 6]](https://chandoo.org/img/fm/modeling-cashflow-projections-project-valuation.png)
In the 4th and 5th part of our financial modeling series, we will learn how to model and build cashflow projections for project valuation.
We will understand the basics behind cash-flow modeling, what kind of non-cash expenses should be added back to get the free cash-flow. You can also get the blank and completed cash-flow projection worksheets to practice these techniques.
Continue »How to cook a delicious dynamic chart that will have your boss drool

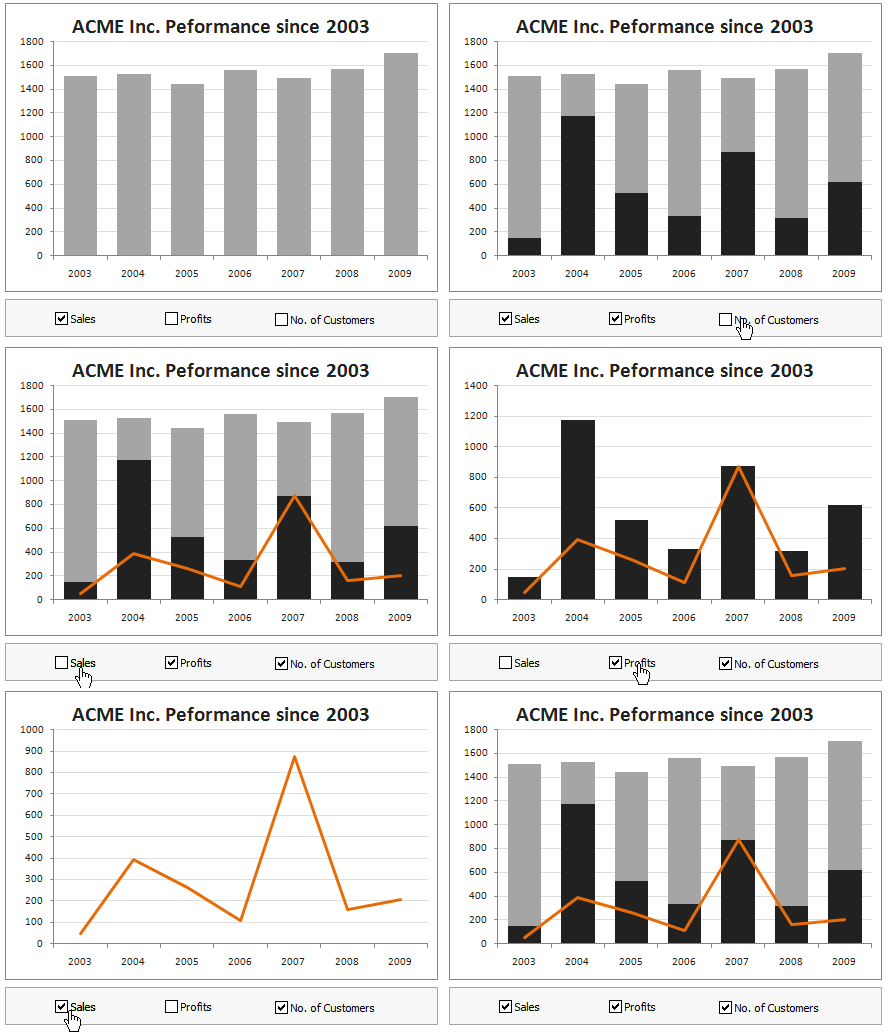
Dynamic charts are like my favorite food, Mangoes. They tempt, tease and taste awesomely. In this post, we are going to learn how to create a dynamic chart using check boxes and formulas as shown in the animation aside. Are you ready for some excel chart cooking?
You can also download a FREE Dynamic chart template from the post. So go ahead and make your boss drool.
Continue »Building Inputs & Assumptions Sheets – Excel Financial Modeling [Part 3 of 6]
![Building Inputs & Assumptions Sheets – Excel Financial Modeling [Part 3 of 6]](https://chandoo.org/img/fm/financial-model-assumptions-inputs.png)
In the third part of our series on Excel Financial Modeling, we teach you how to make an assumptions worksheet to keep track of various investment, working capital and operational assumptions related to project valuation in place.
You can also download the blank worksheet in which you can fill-up assumptions after reading the business case.
Continue »

