All articles with 'downloads' Tag
How to create dynamic sparklines for latest 30 days [video]
![How to create dynamic sparklines for latest 30 days [video]](https://chandoo.org/wp/wp-content/uploads/2015/08/dynamic-sparklines-v2.png)
Sparklines are fun and very insightful. They are easy to create, easy to maintain and fit into any dashboard.
But there is one tiny problem with them. Usually we have a lot of data, but we don’t to visualize all of it. We just want to visualize latest 30 days trend or last 12 months trend or QTD or something similar. What then?
In this video, learn a powerful and very simple way to create dynamic sparklines using Excel.
Continue »Shading an area chart with different colors for up & down movements [case study]
![Shading an area chart with different colors for up & down movements [case study]](https://chandoo.org/wp/wp-content/uploads/2015/07/indian-stock-market-chart.png)
We all know that area charts are great for understanding how a list of values have changed over time. Today, let’s learn how to create an area chart that shows different colors for upward & downward movements.
The inspiration for this came from a recent chart published in Wall Street Journal about Chinese stock markets.
We will try to create a similar chart using Excel. We are going to create the above chart in Excel.
Looks interesting? Read on…
Continue »CP039: May the FOR Loop be with you – Introduction to For Loops in Excel VBA
Podcast: Play in new window | Download
Subscribe: Apple Podcasts | Spotify | RSS
In the 39th session of Chandoo.org podcast, Let’s learn about FOR loops.
There is a special giveaway in this podcast. It is a workbook with several FOR loop VBA code examples. Listen to the episode for instructions.

What is in this session?
In this podcast,
- Announcements
- What is a loop – plain English & technical definitions
- For Loop vs. other kind of loops (While & Until)
- For Next loops
- For Each loops
- Nested For loops
- Special tips on For loops
- Performance issues & infinite loops
- Conclusions & giveaway
Quickly filter a table by combination of selected cell values using VBA

Filtering is one of the most used feature in Excel. It is a quick way to take lots of data and narrow down to the subset we want.
But here is one common filtering scenario that is slow as snail.
Imagine you are looking at some sort of sales data (if you can’t imagine, look at the above demo).
Now, you want to filter this list for gender=male, profession=self-employed, product category = chocolates and quantity = 1.
If you use the right click, filter > filter by selected value approach, this will take several clicks.
Wouldn’t it be cool if you can select the entire combination and say filter?
Unfortunately, no such feature exists in Excel.
But you are not aiming to be ordinary in Excel. You are aiming to be awesome in Excel. That means, you don’t take no for answer.
Fortunately, we can quickly write a VBA macro that filters a list by selection. So let’s do that.
Continue »Introduction to Slicers – What are they, how to use them, tips, advanced techniques & interactive reports using Excel Slicers

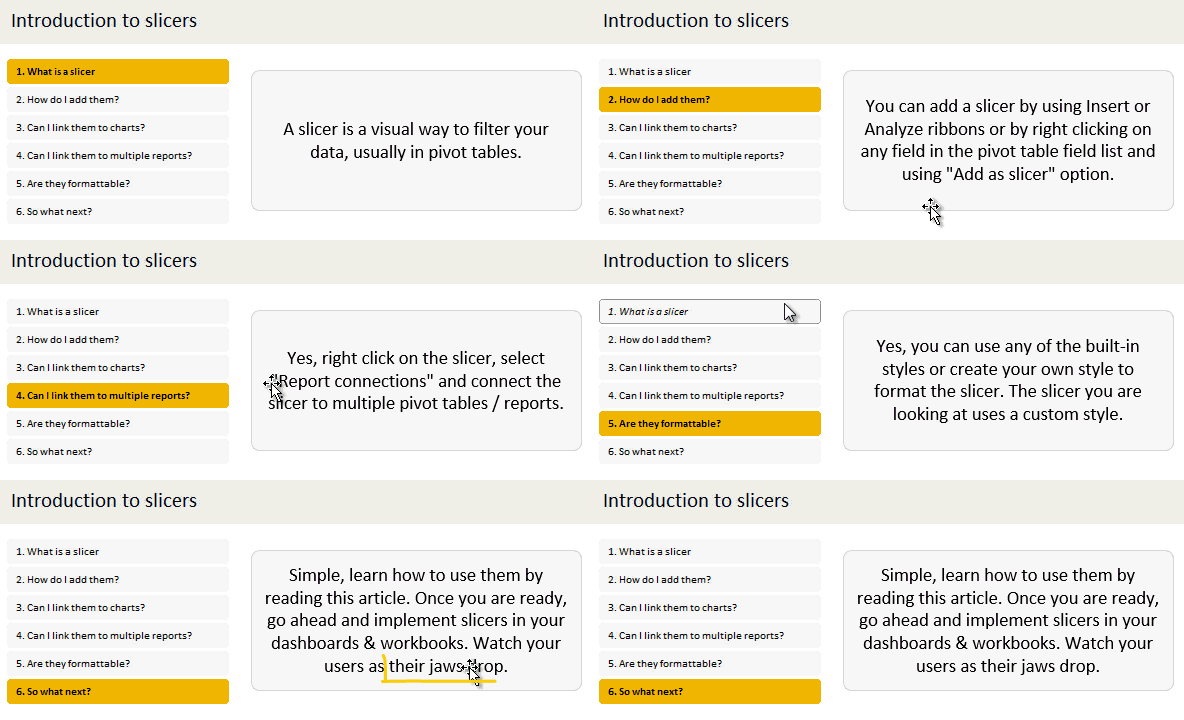
Slicers are one of my favorite feature in Excel. And here is a quick demo to show why they are my favorite.
Slicers – what are they?
Slicers are visual filters. Using a slicer, you can filter your data (or pivot table, pivot chart) by clicking on the type of data you want.
For example, let’s say you are looking at sales by customer profession in a pivot report. And you want to see how the sales are for a particular region. There are 2 options for you do drill down to an individual region level.
- Add region as report filter and filter for the region you want.
- Add a slicer on region and click on the region you want.
With a report filter (or any other filter), you will have to click several times to pick one store. With slicers, it is a matter of simple click.
Read more to learn all about slicers
Continue »Calculating Billy’s total working hours [solution & discussion]
Few days ago, I asked you “How many hours did Billy work?” There were more than 100 responses with lots of innovative solutions.
So today, let’s examine various ways to calculate total working hours given start & end times of tasks. Please watch below video.
Calculating Bill’s total working hours (video)
Continue »How many hours did Billy work? [Solve this]
Here is a simple but tricky problem. Imagine you are the HR manager of a teeny-tiny manufacturing company. As your company is small, you just have one employee in the shop floor. He is Mr. Billy. As this is a one person production facility, Billy has the flexibility to choose his working hours. At the […]
Continue »Narrating the story of change using Excel charts – case study

Here are three questions you often hear from your boss:
- What changes are happening in our business and how do they look?
- Do you know how to operate this new coffee machine?
- Why does every list has 3 items?
Jokes aside, our urge to find change in environment predates cave drawing, slice bread and Tommy Lee Jones. So, today let’s examine a very effective chart that tells the story of change and re-create it in Excel.
Continue »Ensure cleaner input dates with conditional formatting [quick tip]
![Ensure cleaner input dates with conditional formatting [quick tip]](https://chandoo.org/wp/wp-content/uploads/2015/05/cleaner-dates-demo.gif)
Here is a familiar problem: You create a workbook to track some data. You ask your staff to fill up the data. Almost all the input data is fine, except the date column. Every one types dates in their own format. Here is a fun, simple & powerful way to warn your users when they […]
Continue »
Learn two techniques to conditionally format the background of a chart based on some external value.
Continue »Celebrate Holi with this colorful Excel file

Today is Holi, the festival of colors in India. It is a fun festival where people smear each other with colors, water balloons, tomatoes and sometimes rotten eggs. This year we wanted to play with only water guns, but kids vetoed that idea vehemently. So we ended up driving to my sister-in-law’s place to play with colors (there were no rotten eggs or tomatoes, thankfully).
Let me smear a few colors on you
I would love to splash a jug full of color water on you and say Happy Holi. But the internets have not advanced thus far. So I am going to give you the next best option.
An Excel workbook to play holi
Continue »CP031: Invisibility Tricks – How to make things disappear in Excel?

Podcast: Play in new window | Download
Subscribe: Apple Podcasts | Spotify | RSS
In the 31st session of Chandoo.org podcast, let’s disappear.
What is in this session?
Spreadsheets are complex things. They have outputs, calculation tabs, inputs, VBA code, from controls, charts, pivot tables and occasional picture of hello kitty. But when it comes to making a workbook production ready, you may want to hide away few things so it looks tidy.
That is our topic for this podcast session.
In this podcast, you will learn
- Quick announcements first anniversary of our podcast etc.
- Hiding cells, rows, columns & sheets
- Hiding chart data points
- On/off effect with form controls, conditional formatting
- Making objects, charts, pictures disappear
- Disabling grid-lines, formula bar & headings
- Hiding things in print
CP030: Detecting fraud in data using Excel – 5 techniques for you
Podcast: Play in new window | Download
Subscribe: Apple Podcasts | Spotify | RSS
In the 30th session of Chandoo.org podcast, let’s learn how to uncover fraud in data.

What is in this session?
In the wake of hedge fund scams, accounting frauds and globalization, We, analysts are constantly second guessing every source of data. So how do you answer a simple question like, “am I being lied to?” while looking at a set of numbers your supplier has sent you.
That is our topic for this podcast session.
In this podcast, you will learn
- Quick announcements about 50 ways & 200k BRM
- Introduction to fraud detection
- 5 techniques for detecting fraud
- Benford’s law
- Auto correlation
- Discontinuity at zero
- Analysis of distribution
- Learning systems & decision trees
- Implementing these techniques in Excel
- A word of caution
![Who is the most consistent seller? [BYOD]](https://chandoo.org/wp/wp-content/uploads/2015/02/who-is-the-most-consistent-seller-data.png)
Who is the most consistent of all?
Imagine you are a category manager at a large e-commerce company. Your site offers various products, but you don’t really make these products. You list products made by other vendors on your site. Every day, these vendors would send you invoices for the amount of product they have sold. Above is a snapshot of such invoices.
Looking at this list, you have a few questions.
- Who is the best seller?
- Who is the most active seller?
- Who is the most consistent seller?
- Which seller has fewest invoices?
Let’s go ahead and answer these using Excel. Shall we?
Continue »Revenue vs. Commission growth – Getting the message across [BYOD]
Situation: Our commissions are growing way faster than revenues
Let’s say you are looking revenues & sales commissions of your company for last few years. The data looks like this:

And you want to highlight the fact that commissions are growing faster than revenues.
So you plot YoY growth rates for revenues & commissions.
Problem: The chart of YoY growth rates is not convincing
Take a look at the chart. It doesn’t convey the message that we want. At best it says “revenue growth is less than commission growth”

How to convey the message “Commission growth is a problem for us”?
Continue »

