Do you want to enable developer ribbon and use VBA in Excel? Follow these simple steps: Step 1: Right click any ribbon name Step 2: Select “Customize Ribbon” Step 3: This opens the Excel Options. From here, Check the “Developer” option in the right side panel Step 4: Click ok. Your developer ribbon is now […]
Continue »
You want to check two conditions with Excel IF function? You’ve come to the right place. IF is one of Excel’s most popular and versatile functions. But things get exciting when you start combining it with multiple conditions — especially using AND, OR, nested IFs, and even blending it with SUMIFS. In this article, let […]
Continue »
Ever wanted to get a set of dates, but don’t want to manually type? Here are three ways to insert dates in Excel automatically. Option1: Enter a start date and Drag down This is the easiest option if you just want a handful of dates. Just type in your starting date in a cell. Click […]
Continue »How to create SVG DAX Measures in Power BI (Easy, step-by-step Tutorial with Sample File)

SVG (Scalable Vector Graphics) is a great way to add a bit of flavor and pizzazz to your boring Power BI reports. I have been using them for a while and really love how easy and fun they are to work with. So today, let me share the technique and provide sample measure code that […]
Continue »How to Create a Power BI Dashboard for Insurance Analytics (With Examples)

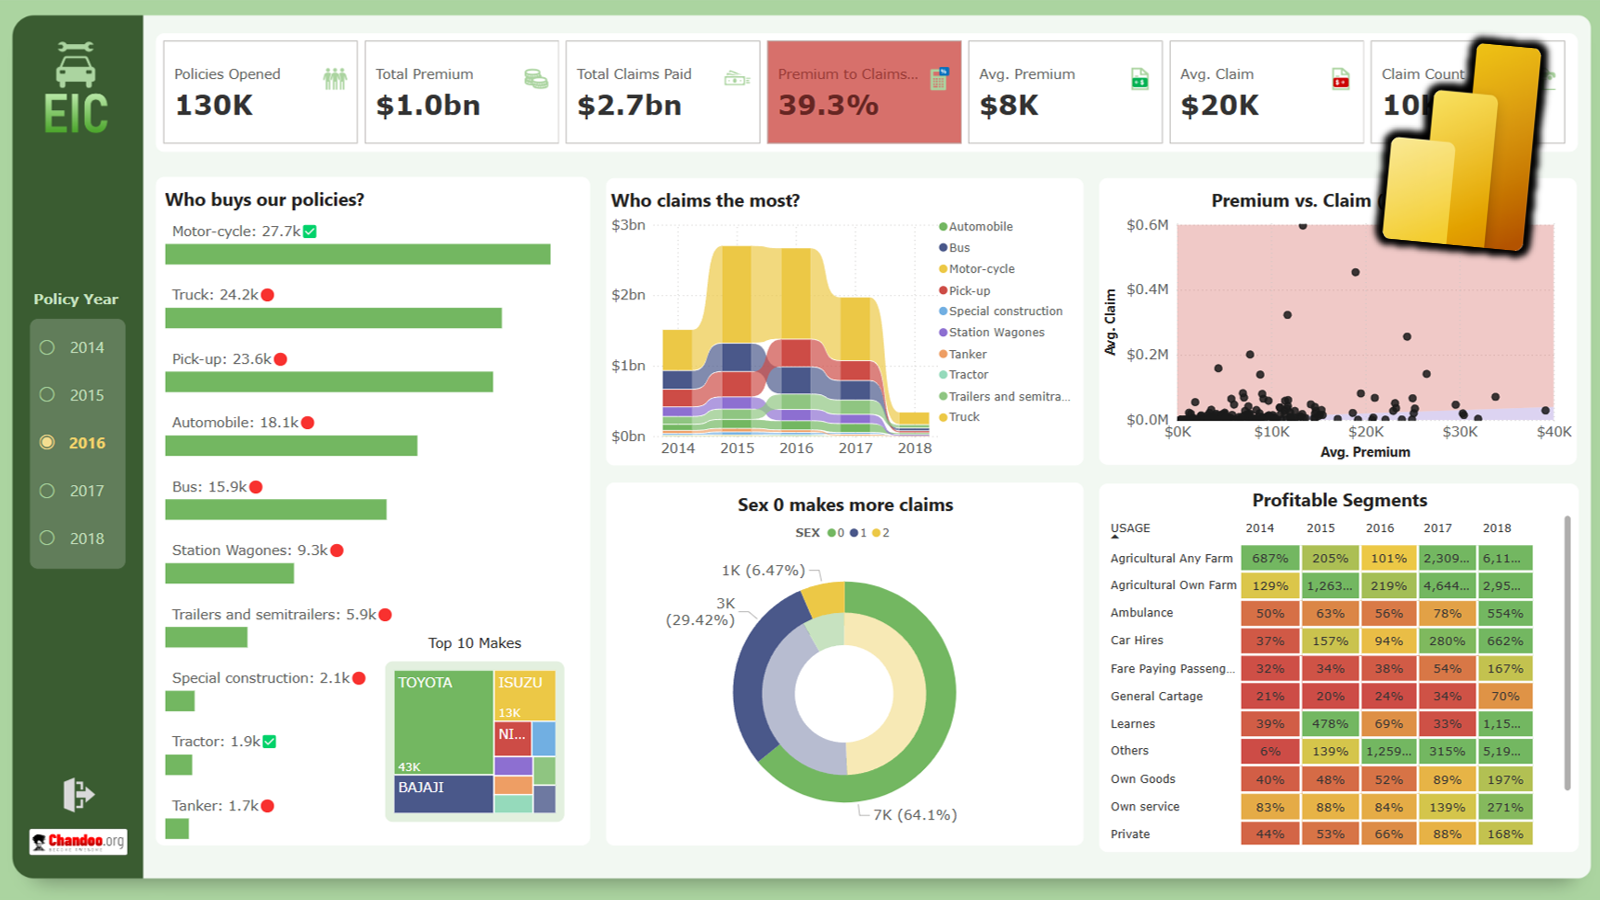
1. Introduction Insurance is a perfect industry for data analysis. There is plenty of data – right from lead generation to to underwriting to policy issuance to administration to claims processing. With a careful and well thought data strategy insurance companies can become profitable. Power BI makes data analysis in insurance space a breeze. Whether […]
Continue »
JSON (JaveScript Object Notation) is a popular and easy format to store, share and distribute data. It is often used by websites, APIs and streaming (real-time) systems. But it is also cumbersome and hard to use for performing typical data tasks like summarizing, pivoting, filtering or visualizing. That is why you may want to convert […]
Continue »New vs. Returning Customers Analysis with DAX [Easy Formulas]
![New vs. Returning Customers Analysis with DAX [Easy Formulas]](https://chandoo.org/wp/wp-content/uploads/2025/03/SNAG-0107.png)
DAX offers powerful way to analyze “new” vs. “returning” customers. In this article learn easy and simple DAX measure patterns to count number of new customers and number of returning customers from your data. What is a Returning Customer? A returning customer is someone who comes back to our business and does another transaction. For […]
Continue »

