All articles in 'Pivot Tables & Charts' Category
Show monthly values & % changes in one pivot table
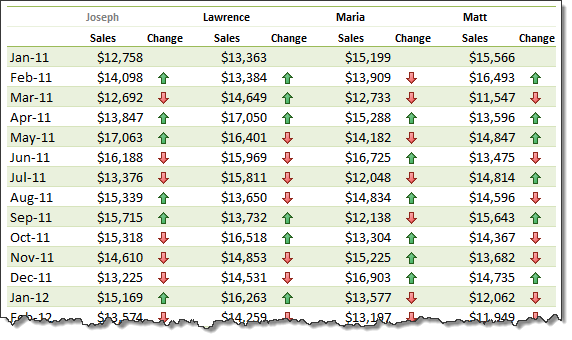
Pivot tables are great help when analyzing lots of data. One of the common questions managers & analysts ask (when looking at monthly sales data for example) is,
How is the monthly performance of our teams (or regions, products etc.)?
A pivot report can answer this question in a snap. Today lets learn how to do that.
Continue »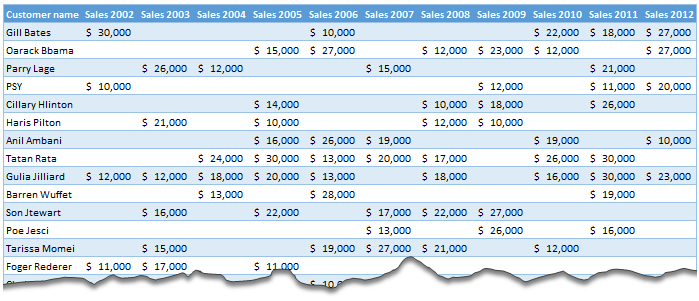
Moosa, one of our readers emailed this interesting question:
I have huge list of customers (around 1500).
Table includes following information
Customer # , Customer Name, Sales 2002, sales 2003, … sales 2012My requirements are
1. list of customer who did not have sales during all these years
2. List of customer who have not business from 2003
3. List of customer who have not business from 2004
Today, lets learn how to identify all the non-performing customers.
Continue »Sort Pivot Tables the way you want [Quick tip]
![Sort Pivot Tables the way you want [Quick tip]](https://img.chandoo.org/pivot/custom-sorting-pivot-tables.gif)
Ever looked at a Pivot table & wondered how you can sort it differently?
“If only I could show this report of monthly sales such that our best months are on top!”
Well, there is a way to do it without sacrificing 2 goats or pleasing the office Excel god. Just use custom sorting options in Pivot tables.
Continue »
Pivot tables are a great way of summarising and consolidating data to produce summary reports.
One of the main limitations of Pivot tables is that they don’t natively return Text values.
This post looks at a method to work around this without the use of VBA.
Continue »Do you use Pivot Tables? What do you use them for & where do you struggle [Survey]
If you like to analyze data, then you would fall in love with Pivot Tables on first sight. Pivot tables are a powerful, dead-simple & lovely way to play with your data, automate your reports and save time. That said, not all of us know how to use them or how to get them to […]
Continue »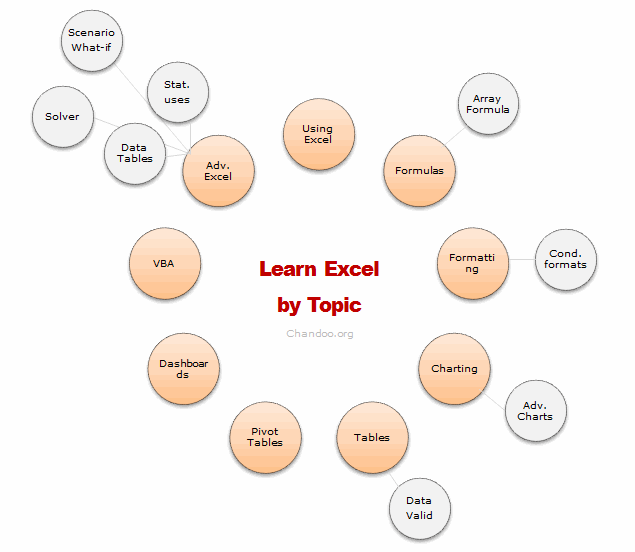
Last week I asked, What is one area of Excel you want to learn more?
More than 250 of you responded to this question. Many of you shared your areas of interest thru comments, quite a few of you also emailed me personally.
So what next?
You told us what you want to learn, the next step is logical. We share some of the best tutorials & examples with you so that you can learn. In this post, we have presented more than 75 links, to help you learn your area of focus.
I have divided this in to 16 areas. In each area, we have identified (upto) 5 best links for you to learn more. I have also recommended 1 or 2 training programs that make you awesome in that area. Plus, if we found any excellent external resources, we have highlighted them as well.
So go ahead and learn Excel.
Continue »Switch Scenarios Dynamically using Slicers
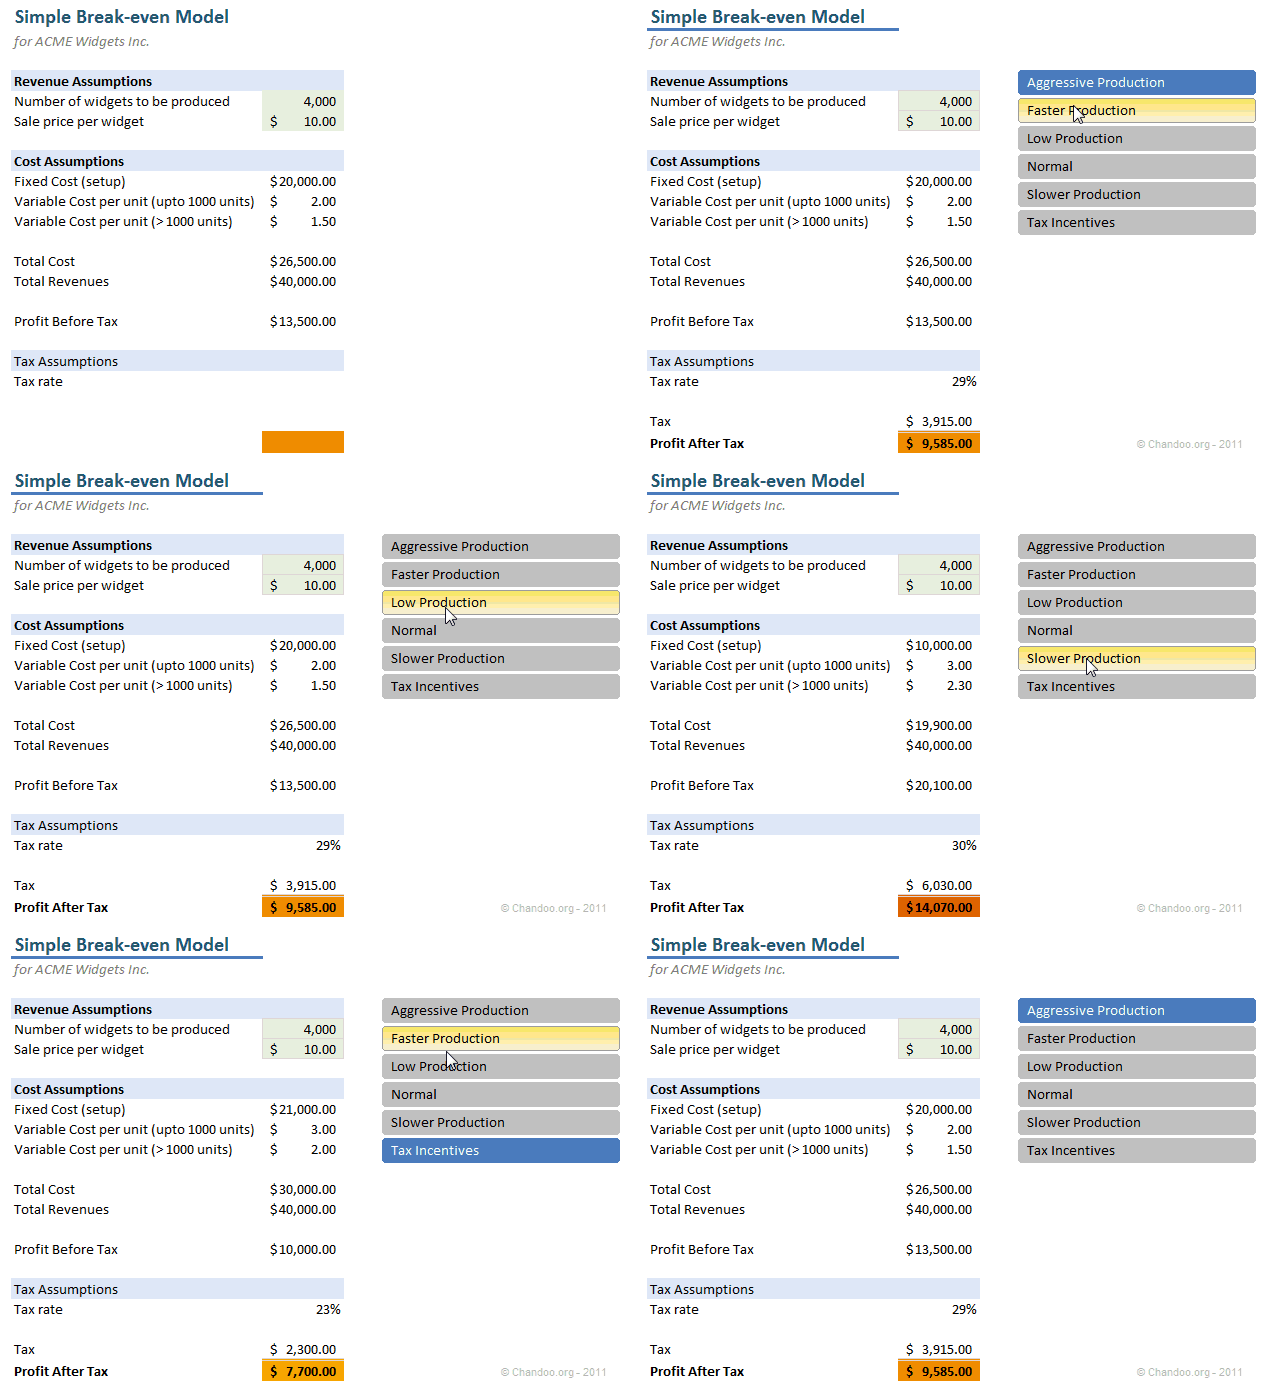
Slicers are my new favorite feature in Excel. Introduced in Excel 2010, Slicers are like visual filters.
Now, we can use slicers creatively to make an interactive scenario manager in Excel, as you can see below. We will learn how to create this in Excel in today’s post.
Continue »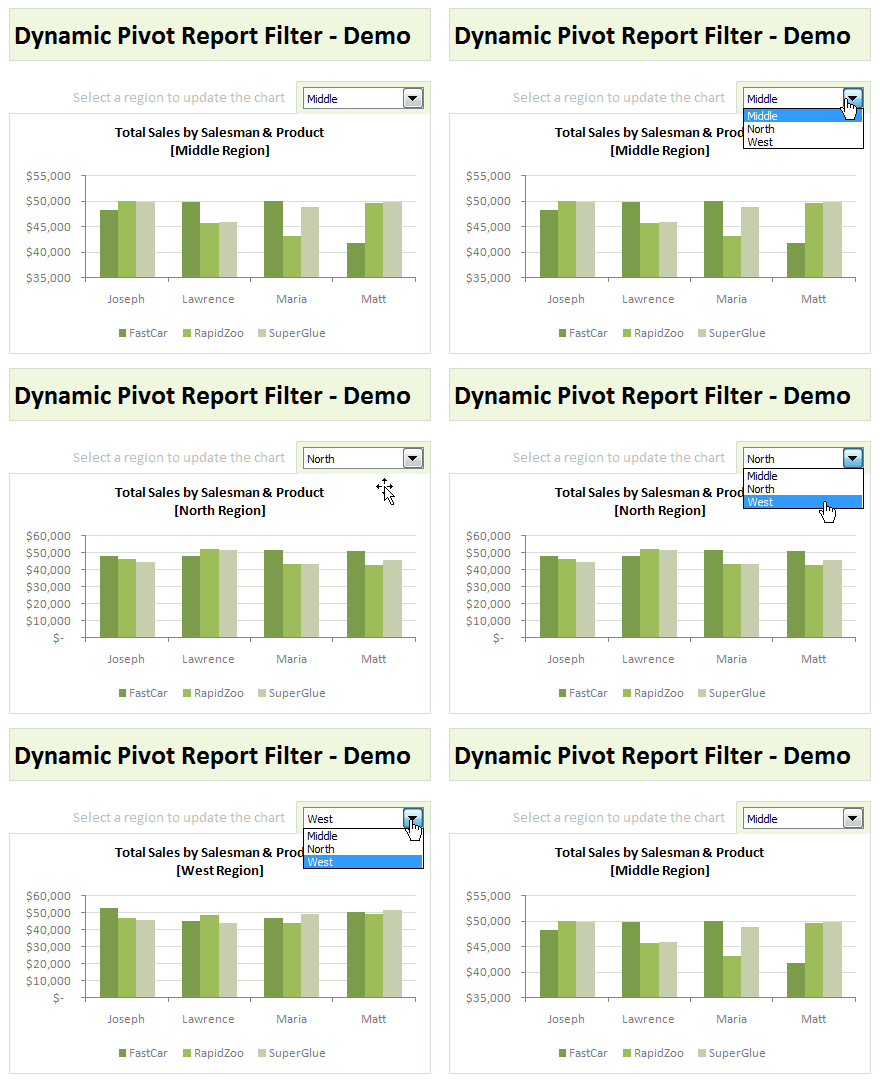
Last week, we have learned what Pivot Table Report Filters are & how to use them.
Today, I am going to show, how you can use simple macro code to change the report filter value dynamically.
We will learn how to create the chart shown here.
Continue »What are Pivot Table Report Filters and How to use them?

Today we will learn about Pivot Table Report Filters.
We all know that Pivot Tables help us analyze and report massive amount of data in little time. Excel has several useful pivot table features to help us make all sorts of reports and charts.
Report Filters are one such thing.
Continue »Make Dynamic Dashboards using Pivot Tables & Slicers [Video & Download]
![Make Dynamic Dashboards using Pivot Tables & Slicers [Video & Download]](https://chandoo.org/img/dashboards/dynamic-excel-dashboard-using-pivot-slicers-demo.png)
Do you know that Excel 2010 makes creation of dynamic dashboards very simple?
Yes, that is right. Using slicers feature, you can create dynamic excel dashboards from your data in very little time. Today we are going to learn a technique that will help you create a dashboard like below.
Read rest of this post to find out how to construct a dynamic dashboard in Excel & download the example workbook.
Continue »Show Top 10 Values in Dashboards using Pivot Tables
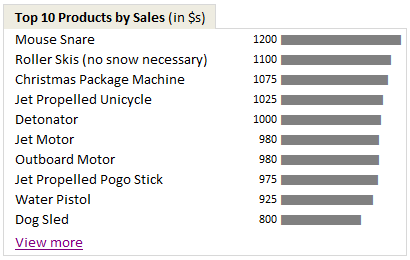
A good dashboard must show important information at a glance and provide option to drill down for details.
Showing Top 10 (or bottom 10) lists in a dashboard is a good way to achieve this (see aside). Today we will learn an interesting technique to do this in Excel.
Continue »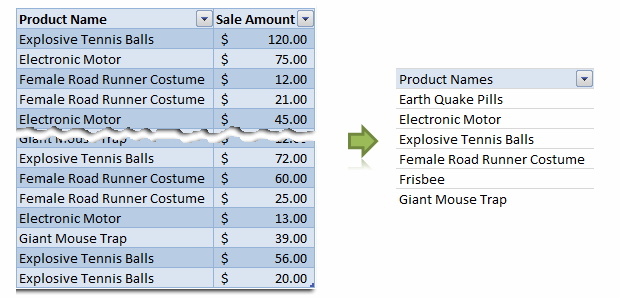
Removing duplicate data is like morning coffee for us, data analysts. Our day must start with it. It is no wonder that I have written extensively about it (here: 1, 2, 3, 4, 5, 6, 7, 8). But today I want to show you a technique I have been using to dynamically extract and sort […]
Continue »How I Analyze Excel School Sales using Pivot Tables [video]
Some of you know that I run an online excel training program called Excel School. If you want to join, click here. Only 8 days left.
I run excel school mainly to meet new students, understand their problems and learn new ways to solve them. But, Excel School also presents me with an interesting analytics challenges. In this post, I will share 2 pivot table based analytic techniques I used just yesterday to answer few questions I had about Excel School sign-ups.
Watch this 15 min. video to see how I analyzed the data
Continue »Budget vs. Actual Profit Loss Report using Pivot Tables
This is continuation of our earlier post Preparing Quarterly and Half yearly P&L using grouping option. You can also do budget v/s actual comparison using Pivot Tables. For this we will use calculated items feature of Excel PivotTables.
To begin, we have to add one more column to our data. I have added column Data Source to the end of data table. Existing data is marked as Actual and I have added more data rows which are marked as Budget. You can download new file with updated data and basic Pivot P&L.
Continue »Quarterly & Half-Yearly Profit Loss Reports [Part 5 of 6]
![Quarterly & Half-Yearly Profit Loss Reports [Part 5 of 6]](https://chandoo.org/img/ea/quarterly-half-yearly-profit-loss-reports-excel.png)
This is continuation of our earlier post Exploring Pivot Table P&L Reports.
We have learned how to change our P&L report on various data elements. We have seen how the P&L report can be changed with just few clicks.
In this post we will be learning some grouping tricks in PivotTables. We will cover grouping of dates, text fields and numeric fields. You will need to start with Monthly P&L report prepared in previous post. We will also learn some really clever tricks and hacks on how to group data in Pivot Tables. So read on…,
Continue »

