Archive for November, 2014

Did you know you can Calculate Pi by throwing Frozen Hotdogs !
No ?
Learn how to calculate Pi by throwing Frozen Hotdogs with this Excel Simulation of Buffon’s Needle.
Can you calculate the sales commission? [homework]
Imagine you run a cute little pastry in Rome (Italy). To boost the sales you have a 2 person sales team. Caterina & Antonio. Caterina is the manager & Antonio, her assistant. Apart from basic salary, they will also receive sales commission. This comes from a portion of net profit allocated to “incentive pool”. The […]
Continue »Open & Save files faster in Excel 2013 [quick tip]
![Open & Save files faster in Excel 2013 [quick tip]](https://img.chandoo.org/q/open-save-files-faster-in-excel.png)
Excel 2013, the newest version of Excel as of writing this has many great features like data modeling, improved pivot tables, power view, flash fill etc. But one thing that I find very annoying is the Open & Save experience. Any time we open a file or save a workbook (which happens alot everyday), we must navigate the painful backstage screen to select our favorite folders. You see, Excel 2013 supports cloud saving. So that means, by default it will show your Office 365 or OneDrive or SkyDrive or whatever fancy new name Microsoft has for these things. But I am not so much in to clouding. Heck, I see a passing cloud in the sky and I almost run inside my house. So what to do?
Simple. We can turn off these features.
Continue »Download today – Introducing Excel Dashboard Templates from Chandoo.org

Friends and readers of Chandoo.org, my newest download, Excel Dashboard Templates are available for your consideration. Click here if you are ready to get them. Read on to know more.
What are Excel Dashboard Templates?
As the name suggests, these are ready to use Excel templates for creating awesome, informative, easy to understand & quick dashboards with your data. You just enter your data, set up few calculation options, decide how your dashboard should look & bingo, a beautiful & insightful dashboard will be created for you. These dashboards are optimized to look great, convey key information & prompt correct action.
Who should buy these templates?
Analysts, managers, reporting professionals, business owners & executives. These templates are designed to help anyone preparing Excel based dashboards, scorecards or KPI reports.
Benefits for you
- Design awesome dashboards in minutes, not months: Don’t waste hours trying to figure out formulas, chart settings and layouts. Instead focus on what your users want, how your business works and use those insights to tell the ‘Excel Dashboard Template’ what you want. Save time and look awesome.
- Accommodate change elegantly: People change. Businesses change. What your boss wanted last month is no longer what she wants today. So when someone asks you, “hmm, can you show me YTD data instead of last 13 months”, or “Can I see top 10 KPIs instead of all”, you just smile and tap a few clicks and bingo, the new dashboard will be ready. These templates are designed to handle change (data, requirements, design preferences and insights).
- Beautiful & Informative: These templates are designed with a delicate balance of beauty & insight. Everything is seamlessly designed, perfectly aligned and precisely calculated so that you & your boss can focus on the insights & decisions. Time tested and well honored visualization principles & guidelines are observed thru-out the reports.
- Built for starters, built for pros: Whether you are just starting with Excel or a seasoned pro, you can find the templates right up your alley. For advanced users, we have many customizations to whet your appetite. Want to build a custom calculation or include another type of sorting, you can do it by tinkering with ‘calculations’ sheet.
Looking up when data won’t play nice – few more alternatives

Recently, we discussed about the case of unwieldy data and how we lookup what we want using formulas like SUMIFS. Today, let us learn few more ways to solve the same problem.
Suitable structure spawns simple solutions
Poorly structured is the 2nd biggest problem of analysts. The first one is not enough coffee. That is why there is a dictum in the data analytics world.
Structure is everything
So, we can easily solve our lookup problem, if our data were to magically re-arranged in 2 column fashion – Data & Value.
Continue »
A Formula based solution to extract records from a table that match a number of criteria.
Continue »CP025: Sexy on spreadsheet, Ugly on Printout

Podcast: Play in new window | Download
Subscribe: Apple Podcasts | Spotify | RSS
In the 25th session of Chandoo.org podcast, let’s learn how to avoid SSUP syndrome.
What is in this session?
Most of us suffer from Sexy on the Spreadsheet, Ugly on Printout syndrome. I used to suffer from it too. This happens because we spend all our attention creating that perfect workbook, report or model. And then, we forget about making the proper print settings.
In this podcast, let’s understand how to create awesome workbooks that look great and print great.
In this podcast, you will learn,
- Frozen & Cars, where my free time goes
- Primer on print settings
- Width & height of printouts
- Page breaks
- Row & column repetitions on every page
- Size & orientation of paper
- Dealing with unprintables
- Proofing your print settings
- Printing whats not on screen
- Closing thoughts
Hello folks,
Its almost ready. Our ready to use Excel dashboard templates are coming to a spreadsheet near you on November 13th.
Here is a teaser preview of the dashboards. Our own official trailer, rated A for awesome.
Watch it below:
http://youtu.be/2-TvjpEKf-o
(see it on our YouTube Channel, alternative link)
Excel Dashboard Templates – What are they?
As the name suggests, these a set of workbooks where you can key in your data, set up how you want the looks & bam, a beautiful, insightful, fun, easy to use dashboard pops right out. All in few minutes.
Here is how these templates can help you:
- Design awesome dashboards in minutes, not months: Don’t waste hours trying to figure out formulas, chart settings and layouts. Instead focus on what your users want, how your business works and use those insights to tell the ‘Excel Dashboard Template’ what you want. Save time and look awesome.
- Accommodate change elegantly: People change. Businesses change. What your boss wanted last month is no longer what she wants today. So when someone asks you, “hmm, can you show me YTD data instead of last 13 months”, or “Can I see top 10 KPIs instead of all”, you just smile and tap a few clicks and bingo, the new dashboard will be ready. These templates are designed to handle change (data, requirements, design preferences and insights).
- Customize everything: Unlike a template set in stone, these are designed to let you customize almost every little aspect of the output, calculations and behavior.
- Beautiful & Informative: These templates are designed with a delicate balance of beauty & insight. Everything is seamlessly designed, perfectly aligned and precisely calculated so that you & your boss can focus on the insights & decisions. Time tested and well honored visualization principles & guidelines are observed thru-out the reports.
- Built for starters, built for pros: Whether you are just starting with Excel or a seasoned pro, you can find the templates right up your alley. For advanced users, we have many customizations to whet your appetite. Want to build a custom calculation or include another type of sorting, you can do it by tinkering with ‘calculations’ sheet.
Looking up when the data won’t co-operate (case study)

Occasionally we deal with data that is so uncooperative that we might as well give up and go back to calculators & ledger books.
Recently I found myself in such a situation and learned something new.
Introducing … data that won’t play nice
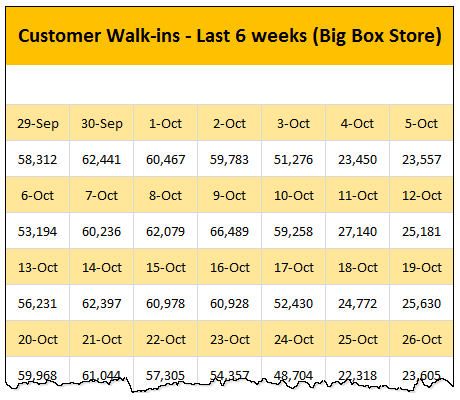
Drum roll please. Here is a data-set that I got from somewhere.
The problem – build a lookup formula
And the problem. Oh, simple. Write a lookup formula to find how many customer walk-ins we have on any given day.
But how?
Continue »

