Archive for July, 2012
How to make Box plots in Excel [Dashboard Essentials]
![How to make Box plots in Excel [Dashboard Essentials]](https://img.chandoo.org/dashboards/bp/box-plot-in-excel-how-to.png)
Whenever we deal with large amounts of data, one of the goals for analysis is, How is this data distributed?
This is where a Box plot can help. According to Wikipedia, a box plot is a convenient way of graphically depicting groups of numerical data through their five-number summaries: the smallest observation (sample minimum), lower quartile (Q1), median (Q2), upper quartile (Q3), and largest observation (sample maximum)
Today, let us learn how to create a box plot using MS Excel. You can also download the example workbook to play with static & interactive versions of box plots.
Continue »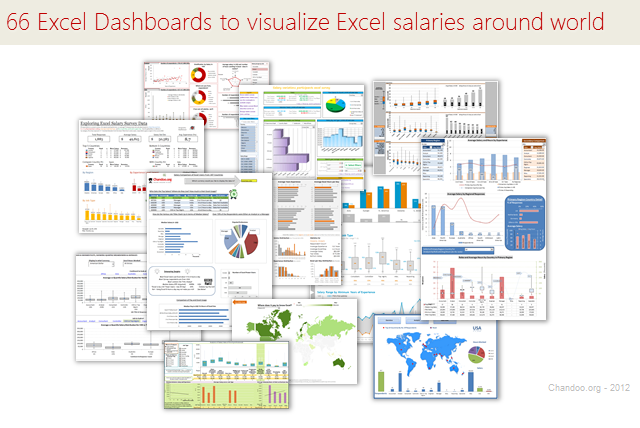
Ladies & gentleman, put on your helmets. This is going to be mind-blowingly awesome.
See how many different ways are there to analyze Excel salary data. Look at these 66 fantastic, beautifully crafted dashboards and learn how to one up your dashboard awesomeness quotient.
Continue »Welcome to Chandoo.org – A short introduction to our site

Welcome to Chandoo.org. Thank you so much for taking time to visit us.
Over the last few weeks, we have quite a few new members to the site. Its good time I said hello and introduced this site to you.
PS: If you have been following chandoo.org for a while, you can still find useful information in this post. So read on.
Continue »
Need to count how many unique values occur in a range?
Learn how to do this and how the formula works right here.
Show only few rows & columns in Excel [Quick tip]
![Show only few rows & columns in Excel [Quick tip]](https://img.chandoo.org/q/show-only-few-rows-and-columns-in-excel.png)
Each new sheet in MS Excel comes up with a 1,048,576 rows and 16,384 columns. While it has a certain binary romantic ring to it (2^20 rows & 2^14 columns), I am yet to meet anyone using even half the number of rows & columns Excel has to offer.
So why leave all those empty rows & columns hanging in your reports?
Would it not look cool if your reports showed only few rows & columns as needed, like this:
Continue »Analyzing 20,000 Comments
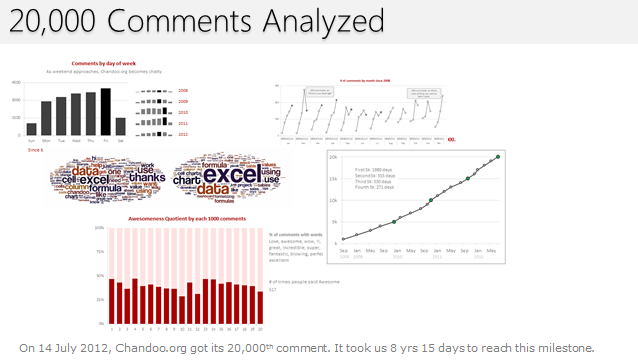
On 14th July, evening 4:51 PM (GMT), Chandoo.org received its 20,000th comment. 20,000!
The lucky commenter was Ishav Arora, who chimed, “Like super computers…Excel is a super calculator!!!!” in our recent poll.
It took us 8 years & 15 days since the very first comment to get here. And it took just 1 year 7 months & 23 days to add the last 10,000 comments (we had our 10,000th comment on 21st November, 2010).
Out of curiosity, I wanted to understand more about these 20,000 comments. So I downloaded our comment database, dumped it in Excel and start analyzing.
Continue »Financial Modeling School Price Hike from Tomorrow
Hi there,
How was your weekend? We had lovely weather. So spent most of the time playing with kids, running some errands & relaxing.
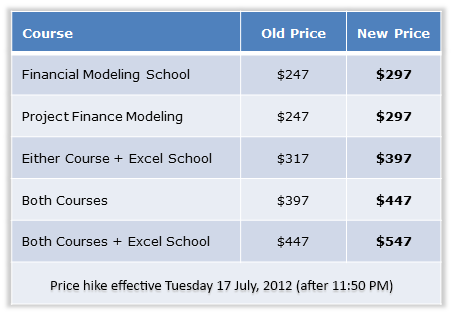
I just want to give you a quick update about our Financial Modeling School. We will be hiking course fees for this program starting tomorrow midnight (Tuesday, 17 July – 11:50 Pacific Time).
If you have been considering to join this program, please go ahead and enroll now to save money.
Click here for course details & Sign-up instructions.
Continue »How do you explain Excel to a small kid? [poll]
![How do you explain Excel to a small kid? [poll]](https://img.chandoo.org/polls/what-area-of-excel-you-want-to-learn.png)
When I was in Perth, I visited Hui’s house one day. Lovely, Hui’s daughter (who is about 14) asked Hui how he knew me. So Hui told that we both share a passion for Excel and that;s how we got to know each other. Then she asked, What is Excel?
At this point, we both tried to explain what Excel is to her in a few ways with no success. Later Hui came up with a brilliant explanation.
He said, Excel has lots of small calculators all interconnected, so that you can do any sort of calculation.
So here is a challenge for you. How would you explain Excel to a small kid (computer literate, but not yet in college).
Continue »
Is my number a Prime Number?
What is a Prime Number?
Today in Formula Forensics we answer both questions.
Continue »Highlight Row & Column of Selected Cell using VBA
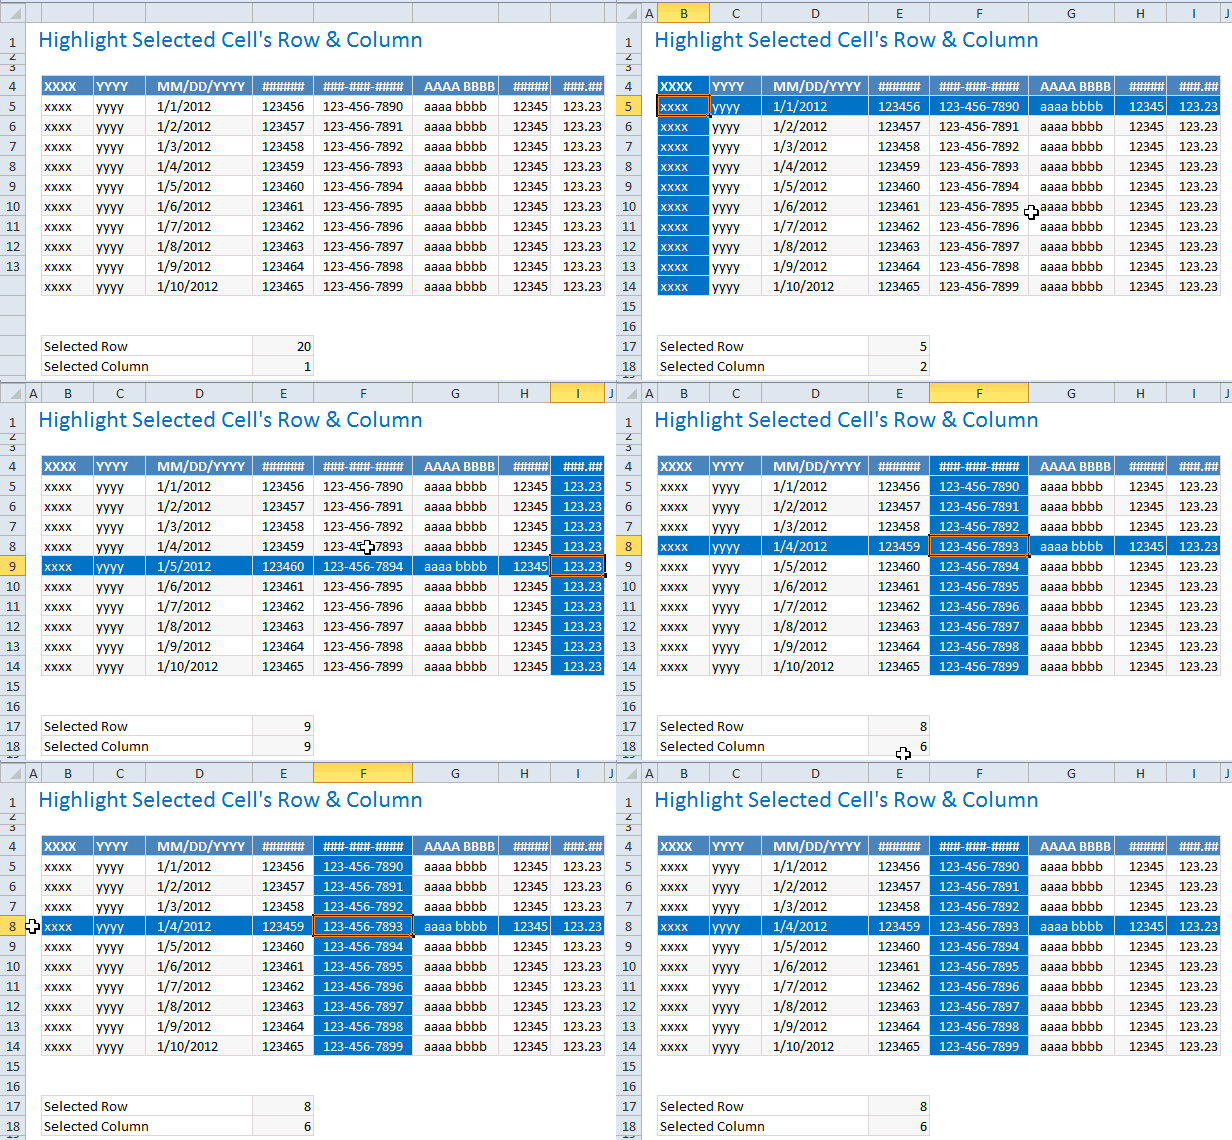
When looking at a big table of analysis (or data), it would make our life simpler if the selected cell’s column and row are highlighted, so that we can instantly compare and get a sense of things. Like above.
Who doesn’t like a little highlighting. So lets learn how to do highlighting today.
Continue »Visualizing Roger Federer’s 7th Wimbledon Win in Excel
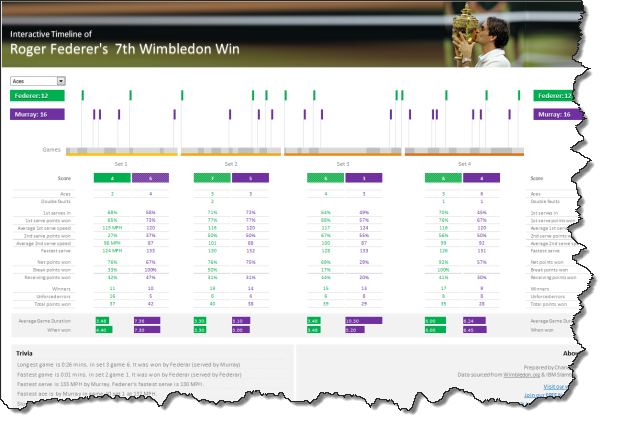
Did I tell you I love tennis? Some of my personal heroes & motivators are tennis players. And as you can guess, I admire Roger Federer. Watching him play inspires me to achieve more. So last night when he lifted Wimbledon trophy for 7th time, I wanted to celebrate the victory too, in my style. So I made an interactive timeline chart in Excel depicting his victory.
Continue »Creating a Masterchef Style Clock in Excel [for fun]
![Creating a Masterchef Style Clock in Excel [for fun]](https://img.chandoo.org/c/mc/master-chef-clock-demo.gif)
Jo (wife) likes to watch Masterchef Australia, a cooking reality show every night. Even though I do not find contestant’s culinary combats comforting, occasionally I just sit and watch. You see, I like food.
The basic premise of the program is who cooks best in given time. To tell people how much time is left, they use a clock that indicates how much time is left (much like a stop clock, with a small twist).
One day, while watching such intense battle, my mind went
It be cool to make such a clock using hmm… Excel?
While I cannot share my snapper (or pretty much any other food item) with you, I can share my Masterchef style Excel clock with you. So behold,
Continue »Find the last date of an activity

We know that using VLOOKUP, we can find a value corresponding to a given item. For example Sales of x. But what if you have multiple sales for each item and you want the last value?
Today lets understand how to find the last date of an activity, given data like above.
Like everything else in Excel, there are multiple ways to finding last date. If cats can use computers, they would hate Excel. You see, Excel is overflowing with unlimited ways to skin a cat.
Continue »
Have you ever wanted to make your own Custom Chart type ?
MarnieB was asked by her boss to make a Spoke Chart !
This post will explain how you can make a custom Excel Spoke Chart and introduce you to techniques that can be used to make other custom chart types.
Continue »

