Archive for June, 2011

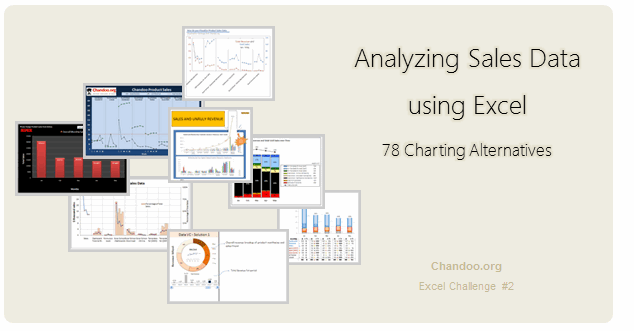
Recently, I ran a contest asking you to analyze a bunch of sales data and present your results in charts. We received a total of 78 charts from 45 people. The contest entries had a mind-boggling variety of excel charts, techniques and ideas. It took me a while to go thru all the files and compile the results. Thanks for your patience. In this post, you can find all the charts along with my comments & links to download files.
Continue »Excel Links – Updates on Singapore Workshop Edition
It has been a while since we had an Excel Links post. So here we are.
First, I want to update you about our Singapore Workshop.
As you know, we have opened the registrations for this workshop last week. If you are in Singapore and want to attend an Excel & Financial Modeling Workshop, Please consider joining us on July 8- 10. For details & enrollment, visit Singapore Bootcamp page.
Apart from the Singapore workshop, I was busy last week conducting live training at CapGemini, in their Hyderabad office on Excel & Dashboards. It was a very good experience. I learned a lot about practical challenges people face when doing sales reports etc. using Excel.
Continue »Automating Repetitive Tasks

Podcast: Play in new window | Download
Subscribe: Apple Podcasts | Spotify | RSS
Over at Newton Excel Bach I spotted the Dynamically Defined Dancing Pendulums. Doug had used Strand7 for the animation.
I thought I could do that in Excel and did.
This post demonstrates some of some basic VBA techniques used to simplify repetitive tasks used during the construction of the project.
For a full project description visit Excel Hero.com.

Chandoo.org is looking for your ideas!
What would you like to see discussed in future posts at Chandoo.org ?

Can I automate 500 Columns of Data Analysis without VBA?
Absolutely!
Excel super function – Data Table to the rescue.
After reading this post, you will be able to process data like a Data Analysis Super Hero !
Continue »Register for our Excel & Financial Modeling Bootcamp in Singapore [Details inside]
![Register for our Excel & Financial Modeling Bootcamp in Singapore [Details inside]](https://img.chandoo.org/speaking/singapore-excel-bootcamp-thumb.jpg)
Hello Friends & Readers,
Our Singapore Excel & Financial Modeling Boot-camp is ready for your consideration.
We will be conducting it from July 8th to 10th.
Please read this short page to know details about the program and how to enroll.
Who is this boot-camp for?
This boot-camp is aimed at business analysts, financial analysts & managers, who use Excel all the time. If you are an Excel new-bie, this boot-camp is not for you. Otherwise, you will enjoy this.
Continue »Win Loss Chart from a Series of Win, Loss Data

Last week, we learned how to create win-loss charts in Excel. In the comments, Dan said,
“Incidentally, the fastest way to do this would be using SFE, just reflect your data with 1 for a win, – 1 for a loss. There’s even an option to automatically invert negative numbers.”
Of course, we can use the beautiful Sparklines for Excel addin to do this and several other charts. But if you just have a series of Wins and Losses, like below, you can use a column chart to create win loss charts too.
Today, we will learn how to create a win loss chart from a set of win, loss data in Excel.
Continue »Comparing Lists of Values in Excel using Array Formulas

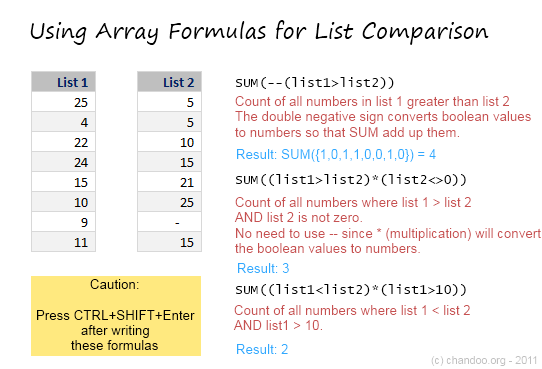
Last week, we had a home work on Calculating Donation Summaries using Excel Formulas. This is a good case where array formulas can help us. So today, we will learn how we can use Array Formulas to compare lists of values and calculate summaries. Towards the end of this post, you can see a video that explains the solution to Donation Summary Calculation problem.
Continue »Amount Donated vs. Pledged [Excel Formula Homework]
![Amount Donated vs. Pledged [Excel Formula Homework]](https://chandoo.org/img/hw/amount-donated-vs-pledged-data.png)
We have some home work folks! Today, lets test your Excel formula skills by giving some data related to a fund.
The problem:
You manage a fund for a non-profit. You have donors who pledge certain amount at the start of the year. As you go thru the year, the donors donate money to your fund. At the end of the year, you have a table like above. And you need to summarize the fund’s performance by calculating various statistics.
Go
Continue »How to create a Win-Loss Chart in Excel? [Tutorial & Template]
![How to create a Win-Loss Chart in Excel? [Tutorial & Template]](https://img.chandoo.org/c/win-loss-chart-excel-template.png)
Win Loss Charts are an interesting way to show a range of outcomes. Lets say, you have data like this:
win, win, win, loss, loss, win, win, loss, loss, win
The Win Loss chart would look like this:

Today, we will learn, how to create Win Loss Charts in Excel.
We will learn how to create Win Loss charts using Conditional Formatting and using In-cell Charts.
Continue »
Many of us start using Excel to keep track of something. And along way, we realize that Excel has a powerful feature called formulas, using which we can automate a lot of things. BOOM! Before we realize, we are in the thick of VLOOKUPs and SUMIFs.
But, along way, we also pick up a few bad habits or believe a few myths. Today, lets bust 10 Excel formula myths that we hear often.
Read this post to learn what these myths and why you should not trust them.
Continue »Do you want to attend an Excel Workshop in Singapore? [Survey]
![Do you want to attend an Excel Workshop in Singapore? [Survey]](https://chandoo.org/img/speaking/singapore-excel-bootcamp-thumb.jpg)
I have happy news for you.
Paramdeep (from Financial Modeling School) and I am going to organize an Excel Workshop in Singapore during first (or second) week of July.
We want to know if you are interested in this. So please take a few minutes and go thru this small post.
Who is this workshop for?
If you are a financial or business analyst, this workshop is for you. We will be discussing various Excel & Financial Modeling topics during the 12 hour workshop (spread across 2-3 days)
Continue »Switch Scenarios Dynamically using Slicers

Slicers are my new favorite feature in Excel. Introduced in Excel 2010, Slicers are like visual filters.
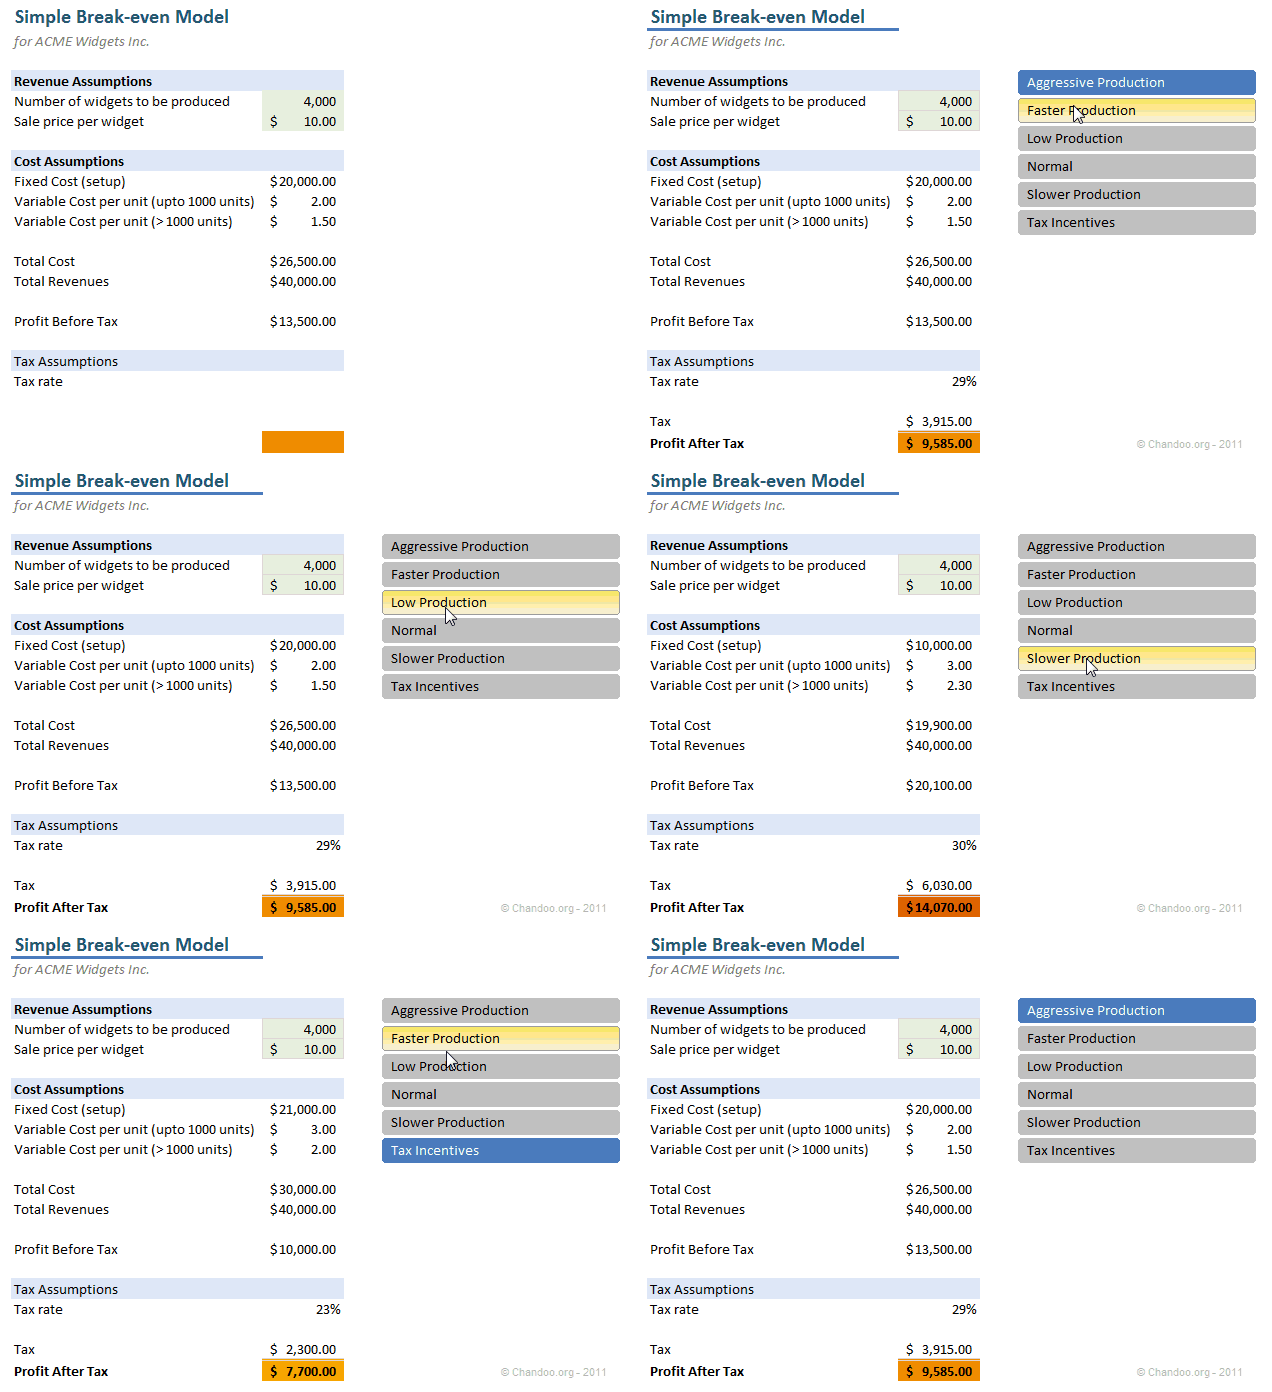
Now, we can use slicers creatively to make an interactive scenario manager in Excel, as you can see below. We will learn how to create this in Excel in today’s post.
Continue »

