All articles with 'countifs' Tag
{ 3 Comments }
Filter one table if the value is in another table (Formula Trick)
Published on Nov 17, 2022 in Learn Excel

I have an orders table and want to see only orders from a given list of products. We can use Excel’s FILTER function to do this.
Continue »{ 16 Comments }
10 Advanced IF formula tricks you must know
Published on Mar 31, 2021 in Learn Excel

IF is the most used Excel function out there. Here are 10 advanced IF tricks to take your formulas to next-level ?
Continue »{ 30 Comments }
How many calls we got outside office hours? [Excel / Power Query homework]
Published on May 3, 2019 in Excel Challenges, Power Query
![How many calls we got outside office hours? [Excel / Power Query homework]](https://chandoo.org/wp/wp-content/uploads/2019/05/calls-outside-office-hours.png)
Time for another Excel formula / Power Query challenge. This is based on a common business data analysis problem. Say you have two tables – calls log and office hours. Call log tells when each call is received. Office hours tell us working hours for seven days of the week. We want to know how many calls are outside office hours.
Continue »
Excel has hundreds of formulas. But as a new learner or user, you may want to just focus on top 10 formulas to get the most out of it. Assuming you already know the basics (check out Beginner Excel page if you are complete newbie), here is a list of top 10 Excel formulas for you.
Continue »
I recently finished a long consulting gig with one of the government ministries in New Zealand. Guess what I was doing? HR Analytics and Reporting. In this post, I want to share my top 5 Excel tips for HR people, based on what I learned in the last 18 months.
Specifically, we will cover:
- Gathering and structuring Employee data in Excel
- How to use Power Query to collect data
- Polish / clean data in Power Query
- Bring cleaner data to Excel as refreshable table
- Answering questions about employees
- Using Excel formulas such as COUNTIFS, SUMIFS, AVERAGEIFS
- Pivot tables for data analysis
- Understanding the results quickly with conditional formatting
- Understanding pay gap
- Calculating gender pay gap
- Visualize pay gap
- Creating salary distribution charts
- Working with histogram charts in Excel 2016 / Office 365
- Making interactive charts
- Generating letters thru mail merge
- Calculating employee bonus based on bonus mapping logic
- Creating 100s of letters with a single click using Mail Merge + Word
Sounds interesting? Read on for details.
Continue »
Excel SUMIFS function is used to calculate the sum of values that meet any criteria. For example, you can calculate the total sales in east zone for product Pod Gun using SUMIFS formula.
In this article, you will learn:
- What is SUMIFS function and how to use it?
- Syntax for SUMIFS
- Using SUMIFS() with tables and structural references
- SUMIFS examples – simple, wild card
- Using SUMIFS() with date & time values
- Free sample file for SUMIFS formula
- More formulas for data analysis
{ 0 Comments }
Avoid Hiring Boo-boos with Excel – COUNTIFS for the win [video]
Published on Apr 26, 2017 in Excel Howtos, Learn Excel
![Avoid Hiring Boo-boos with Excel – COUNTIFS for the win [video]](https://chandoo.org/wp/wp-content/uploads/2017/04/hiring-problem-excel.png)
Imagine you are head of human resources at Casual Contracting Co. Every month you hire a lot of temporary staff who spend 1-4 months with CCC before leaving. Sometimes you hire the same people again. Of late, you have noticed a strange process gap. You are paying same person two (or more) salaries.
This is because you are hiring a person for new temp role even before their current one ended. See above picture.
So how to avoid making such hiring boo-boos.
Simple, using Excel of course.
Continue »{ 21 Comments }
Finding if a cell has 7 in it… [Pattern matching in Excel]
Published on Oct 18, 2016 in Learn Excel
![Finding if a cell has 7 in it… [Pattern matching in Excel]](https://chandoo.org/wp/wp-content/uploads/2016/10/sample-data-pattern-match.png)
Imagine you work at MI5 as a HR officer. You want to find all agents who have license to kill (licence 7). Your data looks like above.
How would you go about it?
If you filter the list or use FIND() or SEARCH() formulas, you will end up with agents who also have licenses 77, 17 or not7. So how would you solve this problem?
Of course, you do what any smart person does. You summon Excel and ask it nicely by using some wicked pattern matching logic.
Continue »{ 13 Comments }
Analyzing half a million complaints – Customer Satisfaction Scorecard [Part 3 of 3]
Published on Feb 23, 2016 in Charts and Graphs, Cool Infographics & Data Visualizations, Learn Excel
![Analyzing half a million complaints – Customer Satisfaction Scorecard [Part 3 of 3]](https://chandoo.org/wp/wp-content/uploads/2016/02/customer-satisfaction-scorecard-analysis-complaints-data.png)
This is the final part of our series on how to analyze half a million customer complaints. Click below links to read part 1 & 2.
- Complaint reason analysis – Part 1
- Regional trends & analysis – Part 2
Customer satisfaction scorecard
In the previous parts of this case study, we understood what kind of complaints were made and where they came from (states). For the customer satisfaction scorecard, let’s focus on individual companies.
Continue »{ 26 Comments }
Employee training tracker & calendar – tutorial & download
Published on Nov 4, 2015 in Charts and Graphs, Learn Excel

Imagine you are the head of training department at ACME Inc. You arrange training programs round the year to empower your team. It is hard work, coordinating between employees, trainers, department heads, venues and coffee machines. What if there is something to help you keep track of all this? I am not talking about getting you a shiny new iPad, you silly. I am talking about a tracker & calendar built in Excel that ties everything together (well, almost everything, you still have to fill the coffee machine.)
We are going to build a training program tracker & calendar using Excel.
Continue »{ 14 Comments }
How to find out if a text contains question? [Excel formulas]
Published on Jul 17, 2015 in Excel Howtos, Learn Excel
![How to find out if a text contains question? [Excel formulas]](https://chandoo.org/wp/wp-content/uploads/2015/07/finding-if-cell-has-question-in-it.png)
On Wednesday (15th July), I ran my first ever webinar, on a topic called, “How to be a BETTER Analyst?” (here is the replay link, in case you missed it). It was a huge success. More than 1,100 people attend the live webinar and hundreds more watched the replay. As part of the webinar, we had interactive Q&A. Viewers posted their questions and I replied to as many of them as I can.
After the webinar, I wanted to make sure I covered all the questions. So I downloaded the chat history. There were more than 700 messages in it. And I am not in the mood to read line by line to find-out the questions. A good portion of chat messages were not questions but stuff like ‘hello everyone, I am from Idaho’, ‘Wow, Chandoo has beard!”, “Enjoying a beer in Belgium while watching webinar” etc. So I wanted a quick way to flag the messages as question or not.
Continue »![Who is the most consistent seller? [BYOD]](https://chandoo.org/wp/wp-content/uploads/2015/02/who-is-the-most-consistent-seller-data.png)
Who is the most consistent of all?
Imagine you are a category manager at a large e-commerce company. Your site offers various products, but you don’t really make these products. You list products made by other vendors on your site. Every day, these vendors would send you invoices for the amount of product they have sold. Above is a snapshot of such invoices.
Looking at this list, you have a few questions.
- Who is the best seller?
- Who is the most active seller?
- Who is the most consistent seller?
- Which seller has fewest invoices?
Let’s go ahead and answer these using Excel. Shall we?
Continue »{ 14 Comments }
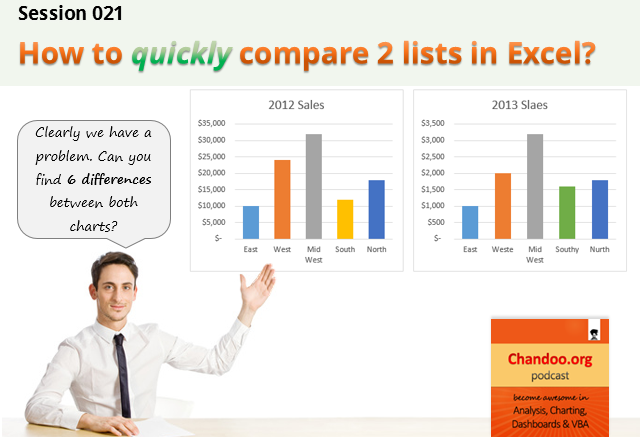
CP021: How to quickly compare 2 lists in Excel
Published on Oct 2, 2014 in Chandoo.org Podcast Sessions, Excel Howtos
Podcast: Play in new window | Download
Subscribe: Apple Podcasts | Spotify | RSS
In the 21st session of Chandoo.org podcast, lets compare lists. Quickly
What is in this session?
Comparing things is a favorite pastime for analysts all over the world. Sadly, it is also an area where we waste hours. So in this episode, I share my top secret comparison techniques to save you time.
Note: This is a short format podcast. That means you spend less time listening to it, while becoming more awesome.
In this podcast, you will learn,
- Why I sound like I am on a secret mission at a mafia hideout.
- 5 ways to compare 2 lists
- Manual method
- Conditional Formatting
- Row Differences
- LOOKUP formulas
- COUNTIF formulas
- Bonus tip: Removing duplicates
- Conclusions
![How to create interactive calendar to highlight events & appointments [Tutorial]](https://img.chandoo.org/vba/interactive-event-calendar-in-excel.png)
One of the popular uses of Excel is to maintain a list of events, appointments or other calendar related stuff. While Excel shines easily when you want to log this data, it has no quick way to visualize this information. But we can use little creativity, conditional formatting, few formulas & 3 lines of VBA code to create a slick, interactive calendar in Excel. Today, lets understand how to do this.
Continue »{ 18 Comments }
Use Advances vs. Declines chart to understand change in values
Published on Feb 21, 2013 in Charts and Graphs
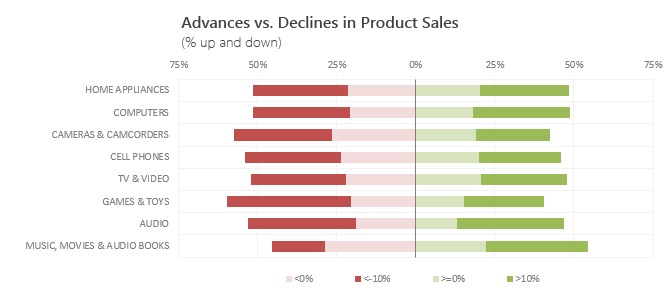
Lets say you are responsible for sales of 100s of products (which belong to handful of categories). You are looking at sales of each product in last month & this month. And you want to understand whether sales are improving or declining by category. How would you do it?
Turns out, this is not a difficult problem. In fact, this question is asked every day & answered using Advances vs. Declines chart.
You may have seen this chart in financial newspapers or websites. Shown above, Advances vs. Declines chart tells us how many items have advanced & how many have declined.
Read on to learn how to create this chart using Excel.
Continue »
