
During last one week, we had a gala time with Dashboard Week on chandoo.org. To wrap-up the week, I am sharing a list of recommended resources, websites, tutorials & ideas for making dashboards.
[Note: I will be sharing your contributions for dashboard week on Monday]
Recommended Resources on Making Dashboards:
I have broken down this post in to various sections. Click on the links to quickly access the part you want to know or just keep scrolling to get the whole thing.
- Books on Dashboards
- Websites for Learning about Dashboards
- Dashboard Training Programs
- Add-ins & Software to Make Dashboards
- Dashboard Tutorials & Downloads on Chandoo.org
Books on Dashboards
Excel Dashboards and Reports by Mike Alexander
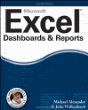
Authored by Mike “Dick” Alexander, a specialist on Bacon, Access, Excel – this book is an excellent guide to you if you need to learn how to make excel dashboards. Mind you the book teaches you various techniques required to construct the dashboards, but the onus of putting together these ideas to come-up with jaw-dropping dashboards is on you.
Information Dashboard Design by Stephen Few
Now, what can I say about this. Stephen Few’s classic book on dashboards is an eye opener for anyone making charts or dashboard reports. Few starts the book by showing what a bad dashboard is and then moves on to tell you how visual cognition works. He later shows a couple of excellent dashboard designs. This book is a must read and refer to if you design dashboards.
Visual Display of Quantitative Information by Edward Tufte
Edward Tufte’s master piece – Visual Display of Quantitative Information is an authoritative guide on how to design charts to communicate information. He shows various examples from history and gives theoretical concepts that you can apply to any chart (or slide) you design.
Business Dashboards – Visual Catalog by Nils Rasmussen
This book, as the name suggests is a catalog of successful dashboards. Nils’ work also includes a handy guide on KPI design and 1000s of KPI examples. A good read if you design dashboards not just based on Excel but many other tools.
Balance Scorecards & Operational Dashboards using Excel by Ron Person
Ron’s book on Balance Scorecards and operational metrics & visualization is a handy guide on how to use Excel’s features to monitor your company’s performance holistically.
Excel Pivot Tables & Pivot Charts by Peter G Aitken
Anyone making dashboards using excel will have to learn how to use Pivot Tables & Pivot charts to their full potential. This book can guide you in that direction.
Excel 2007 – Power Programming by John Walkenbach
Once you set out to make a dashboard using Excel, naturally you might feel powerless but certain feature limitations in Excel. You wish you can tell Excel to do something so that you can save time and do things that are more awesome (like actually improving your business). This is when you can use John’s Excel Power Programming book. The book teaches you how to extend Excel’s capabilities using Macros & VBA.
Non-Designer’s Design Book by Robin Williams
Do not be mis-guided by the small size of this book. This book can transform your ordinary dashboards (or designs / slides etc.) in to truly world class designs. The book teaches you fundamental design concepts and a must read if your job involves visual communication – ie making presentations, excel workbooks or reports.
Websites for Learning about Dashboards
Excel Dashboards Section of our site
This section of chandoo.org site provides you valuable tips, ideas, templates, examples and other useful information on Excel dashboards.
Insightful commentary on the state of business intelligence, dashboards and charting practices.
Robert’s Site on Excel, Tableau, VBA and more
Very good examples of excel & tableau dashboards, techniques, macro code snippets and more.
Dashboard Examples & Commentary

Dashboard screen-shots, commentary and interesting links
Charting principles, commentary from Jorge
This is your bible if you want to arm twist Excel charts
Dashboard Training Programs
Excel School Dashboard Training Program
Well, I have bored you enough with Excel School already, so I will keep this short. If you wish to learn how I make my dashboards, join Excel School.
I am conducting 2 day long, intense, hands-on & practical training on Excel dashboards & data analysis in Chicago, Columbus, Washington DC in May, June 2013. If you live nearby, consider enrolling in this program to become awesome in Excel.
Add-ins & Software to Make Dashboards
Excel Sparklines Adding [highly recommended]
![Excel Sparklines Adding [highly recommended]](http://chandoo.org/img/dashboards/dw/sparklines-for-excel-snapshot.png)
Adds the capability of Micro-charts to Excel. Very powerful, extremely awesome add-in by Fabrice.
Jon Peltier’s Excel Chart Add-ins for frequently used Dashboard charts
Jon’s charting addins are a must have if you make charts like waterfall charts, panel charts, dot plots etc.
Power Pivot helps you analyze massive data and present results in instant dashboards. A free addin from Microsoft and works with Excel 2010.
Tableau Public – for visualizing data & sharing your dashboards with public
Tableau public helps you create visualizations, charts & dashboards and share them with public thru web. A very powerful data analysis and visualization platform.
Charley Kyd’s IncSight DB for making Excel Dashboards
Charley’s Dashboard maker helps you create quick dynamic dashboards using Excel.
Dashboard Tutorials & Downloads on Chandoo.org
- KPI Dashboard using Excel – 6 part tutorial
- Project Management Dashboard in Excel
- Dynamic Dashboard using Excel – 4 part tutorial
- Website Dashboard in Excel
- Sales Dashboards Examples
- Travel Website Dashboard
- Customer Service Dashboard
- Executive Review Dashboard
- Healthcare Dashboard
- Dynamic Dashboard using Excel 2010 – Pivot Tables & Slicers
- Personal Expenses & Finance Dashboards – 7 Examples
What do you recommend for someone learning about Dashboards?
The above links are what I usually rely on when it comes to dashboard education. What about you?
What books, websites, software & training programs do you recommend? Please share using comments.
PS: Links to Jon Pelteir’s Addins, Charley’s Dashboard Kit and Dashboard Books are affiliate links. It means, when you click on the links and purchase these awesome products, I get a small commission. I recommend these products because I genuinely think they are awesome. So go ahead and get your dashboards to awesome level.


15 Responses
THX ! perfekt Overview !
I was hoping you would mention our whitepaper on dashboard design (http://www.juiceanalytics.com/white-papers-guides-and-more/). It is a three-part paper on everything you need to know to design dashboards that people will love to use.
Excelent !!!!! Thank you so much!
Zach,
It would be helpful if JuiceAnalytics didn’t make me register as a precondition to download.
I see a registration page and I turn the other way.
How about a direct link without the email address farming interface?
How I registered
You guys are such a great resource! It is fun to see what other Excel geeks are creating. On to implementation!
Very good ressources, thank you Chandoo.
I think we can add presentation zen. For me, this book is a good for how to make simple presenatations and graph and why not dashboard…
I have a good supprise to see “Non-designer’s design book”. Very usefull book.
And what do you think about “Performance Dashboards” : Wayne W. Eckerson.
This book don’t speak about design dashboards but about what are dashboards,which type of dashboards and how they work…
Very nice resources for designing Dashboards.,thx a lot chandoo..
In Brazil, we have two presencial trainings called “Dashboards em Excel” (1,5 days) 🙂 and “relatorios gerenciais em Excel” (3,5 days)
hi,
could you please add some dashboard for purchase dept.