
Last week, I received an email from Francis, with the following message.
Hi Channdoo,
I would like to express my gratitude for sharing with me using Excel to create dashboard !
I have spend 2 days over the weekend and learn as much as I could and came up with a dashboard for my company Sales and Marketing Meeting !..
Attached is the print screen…
Without you, this is not Possible !!!
Thanks so much !!! The more I learn, the more I know what I dont know !!!
Readers like Francis inspire me most. Despite doing all the work himself, he showed extreme kindness in emailing and making me happy.
Naturally, I replied to him and asked “if he can share original excel file with dummy data so rest of our readers can learn from what he produced.”
Francis agreed for this and shared a version of dashboard with me.
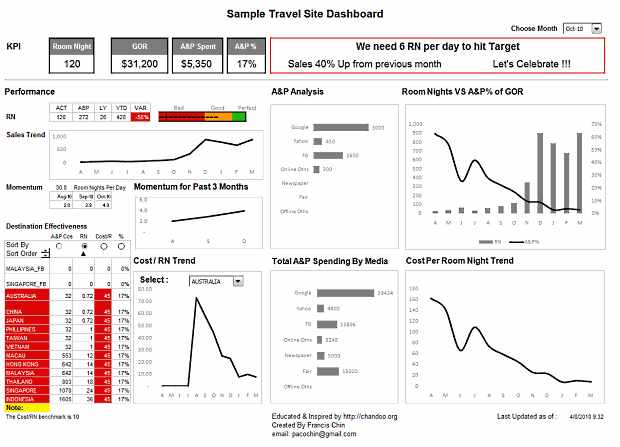
The Travel Site Dashboard Francis Made:
Here is a screenshot of the dashboard Francis made.
Video Review of the Dashboard in Action:
The image doesnt do justice to the awesome work by him. So I made a short video review of the dashboard (6 min). Watch it below:
Techniques used in this Dashboard:
Francis used a variety of techniques in making this dashboard. Some of the important ideas are,
- Using a bullet chart to show current performance vs. last year (tip: making bullet charts in excel)
- Showing a sortable KPI grid to provide on-demand analysis (tutorial: making KPI dashboards in excel)
- Showing key messages as text at the top (idea: use tweetboards instead of dashboards)
- Adding a month selection option at top (formulas: INDEX and OFFSET)
- Dynamic charts that are connected to drop-down boxes (reference: dynamic charts in excel)
How to Make Dashboards in Excel?
Here is our how to make dashboards in excel page. I am sure it will blow your mind. Go check it out.
Download the Dashboard
Click here to download the source file of this dashboard and play with it. [mirror]
Thank you Francis
Thank you so much for sharing your awesome work with all of us Francis. You inspire me and our readers to go that extra mile. 🙂
Send your tips / downloads for Reader Awesomeness Week:
You too can participate and share what you know by simply filling up online form. Be awesome. (details here)


39 Responses
Great job, Francis. I’m impressed that it only took you a weekend. Thanks for sharing, Chandoo!
Francis:
Lots of good dataviz principles used here. A few more suggestions?
The red foreground makes it hard to read the values; red vs green in the bullet chart can’t be separated by colour blind people (8-10% of the population)- try blue instead of green; use more subdued colours; lighten shading and borders for KPIs on top left; lighten all frames even more; order A&P Analysis and Total A&P Spending By Media by descending values; remove %symbol on every tick mark for Room Nights VS A&P% of GOR – it’s already in the title; separate the RN and A&P% charts OR use a different colour for the A&P line and use that same colour for the A&P axis and eliminate the need for a legend.
Good work!
Great work, Francis. Truly inspiring…. I am still wondering if so much can be learned over a weekend :). I am looking into the sample file and would be back with further comments/compliments soon.. Thanks for starting reader’s week Purna
Is there a password for the sheet? I am unable to change anything to ‘play’ with.
Hi all ! I am thrill to be part of this thriving community ! Actually the reason when I have to learn as much as possible over the weekend, is because, I have a presentation on Monday !!! I have no choice !! ahaha, but I guess, this “pressure” somehow forces me to pick up the key concept and with some fundamentals in excel that i already have, together with the great tutorials and examples found in this site make this dashboard possible.
and I like to share with you this : my audience were WOW !
Bill, thanks for your comment ! Indeed, I acknowledge all you said, I will also need to learn how to dynamically re-order the chart by descending value…(any tips?) !
It’s 2am here in Malaysia, I cant sleep !!!
Francis
Rich and everyone else,
if you like to have a the file with sample data, please email me pacochin at gmail dot com
i will send it to you…
🙂
@Francis
Well done on producing such awesome work!
It is truly inspiring what you put together in two days.
Bravo!
@Chandoo
1. For the YouTube video for this article (http://www.youtube.com/watch?v=5rO2N2nzL5g).
* Please include a link back to the article (http://chandoo.org/wp/2010/08/04/travel-site-dashboard-review/) in the video description, or as an annotation.
* This will help YouTube visitors get back to the related content.
@Rich and all: I have removed the protection from the file as I realized that Francis might be ok with this.
@Francis: You can sort the values for your chart dynamically using formulas like LARGE(). I have described the technique here: http://chandoo.org/wp/2009/11/12/topx-chart/
@Sam: thanks for the suggestion, I have added links to the youtube video now.
@Chandoo > Yup I am perfectly OK with that ! and I will also try out the LARGE() function…to sort the series. 🙂
Thks !
@Francis: This is great stuff. I like the visualizations used. Well done.
@Chandoo: Thanks for sharing these examples. After coming across ur site, I’ve learnt a lot about the nuances of excel. Keep these articles coming.
@Francis: Good job given that you built it over the weekend
Fantastic!! No words to express the sheer beauty and creativity. Mind boggling!
One question – how do you manage the vertical lines in the bullet chart to be so thick? Is this a symbol?
@Roji: Thanks !
@Yusuf: Thanks…with pressure from my boss..i guess it works out !! ahah
@MK: Thanks ! the vertical line in bullet chart is a symbol…look at the parameter sheet…:)
To all Raving FANS of chandoo.org>
Everyone here is so dynamic and helpful. I believed everyone here has a fantastic learning journey ! There is so much we can do with Excel, just unbelievable !
What surprises me was that, i never thought Excel can do such thing and what it provides are tools and it is really up to us and our creativity to create something really awesome combining the applications of these tools and put them work together like a conducting an orchestra !
We are the Conductor ! 🙂
Of course, chandoo.org was the inspirations !
Thumbs UP ! 🙂
@Francis: Wow!! Good job, you have certainly given me lots of ideas – and knowing that you did all this in ONE weekend blows away my excuse of ‘not having enough time’ to put my ideas into practice!!
I can feel my creative Excel juices stirring into action!! Watch this space.
@Chandoo: I discovered your site about 2 weeks ago, and have found it to be an INVALUBLE source of both reference and inspiration. Currently expecting 2nd baby – and am considering calling it Chandoo!! ;o)
@Francis : Again, another wow… The inspiring part is you did this over a weekend.
@Chandoo : You inspired lots of people with this site, keep up the excellent job.
Chandoo: I discovered your site last evening from an article on MSN and found it to be truly inspiring and an invaluble Excel resource for someone like me just stepping into Finance & Accounting. There is so much we can do with Excel, it is just unbelievable. Keep it coming and a big thank you for sharing your Excel knowledge.
Excellent Dashboard …. thanks Francis and Chandoo.
Awesome dashboard. Inspired me. Will doing a similar kind for me. Great work francis.
Hi Ari,
Thanks ! Looking forward to see your awesome work !!!
Really impressive stuff, especially considering the time put in.
Awesome work Francis
Hi,
Wanted to know is it possible that when a user clicks / double clicks on the data label in a chart, it should display the details of the data label. For example in chart if a user clicks on a data label which contains some number it should display the details of the numbers.
It is same as “SHOW DETAILS” in Pivot Tabel
@Ravi
All data points in a chart show you their X, Y values if you hover over them
Or have a look at http://chandoo.org/forums/topic/comments-in-charts
amazing amazing amazing…thanks francis,chandoo…you guys rock…
very well organizsed,crisp,to the point..the ideal dashboard…thanks for sharing
Great work Francis. Thanks Chandoo for sharing it
Great work Francis, Lovely dashboard and neatly explained
Great work Francis, Lovely dashboard and neatly explained.
Wow, just WOW! Just when the boss “pressured” me to create an eye-popping dashboard for the bigshots, I stumbled upon this EXCEL-lent site. With a cool example of a dashboard that’s just exactly what I need to learn from, to boot! Chandoo, great helpful forum you have here. Francis, I can’t wait to WOW (work on weekend) to learn from your sample.
Dashboards are awesome. I dutied my hands this weekend with bullet graphs, thermometer graphs, scrollable data etc. I am going to teach the people at my work place.
Chandoo, thanks a million for such a wonderful forum.
Hi Chandoo,
I must say I immensely enjoy your site. Your clear presentations and sharing your knowledge are to me so much of a fresh note in the jungle that is the internet. I am learning few things here and there as I carve some time out of my daily routine but I am ever so thankful to you for hosting this site. As to the video you presented relative to Francis work, I must say, it was impressive and what is more, your unconditional desire to share others work is most impressive to me.
Chandoo, thank you so much for being so kind and supportive. I wish you good health and lots of much more prosperity.
Persol
Nice one! Thanks!
francis, it’s awesome. this is very inspiring me to create dashboard for sales team in my company, thank you so much…
Francis stated that anyone requesting the files could have them. Does anyone have the data files from Francis? I’ve e-mailed the request several times and have no response. Should you possess, please send to thormodsgard at gmail dot com. Much appreciated.
Something about data visualization dashboards speaks to the human experience. It’s only natural that we act on that creativity with our most treasured tools. For me <a href=”http://techoctave.com/charts/”>JavaScript Charts</a> are my tools of choice and HTML5 my endless canvas. Thanks Channdoo!
There is a problem with this code when the date is 30th. Here the code that breaks during this day.
=CONCATENATE(“We need “,ROUND((D12-C12)/(,0),” RN per day to hit Target”)
30-DAY(TODAY()))
Very impressed with this dashboard I am starting to learn more VBA on my own. I may just sign up for the course here at Chandoo, I’d love to be able to churn out dashboards like this, awesome job showcasing how to truly leverage many different aspects of excel. Super cool!