All articles with 'tutorials' Tag

Excel pivot tables are very useful and powerful feature of MS Excel. They are used to summarize, analyze, explore and present your data. In plain English, it means, you can take the sales data with columns like salesman, region and product-wise revenues and use pivot tables to quickly find out how products are performing in each region.
In this tutorial, we will learn what is a pivot table and how to make a pivot table using excel.
Continue »
Excel table is a series of rows and columns with related data that is managed independently. Excel tables, (known as lists in excel 2003) is a very powerful and supercool feature that you must learn if your work involves handling tables of data.
What is an excel table?
Table is your way of telling excel, “look, all this data from A1 to E25 is related. The row 1 has table headers. Right now we just have 24 rows of data. But I can add more later!”
Continue »
Excel SUMIFS function is used to calculate the sum of values that meet any criteria. For example, you can calculate the total sales in east zone for product Pod Gun using SUMIFS formula.
In this article, you will learn:
- What is SUMIFS function and how to use it?
- Syntax for SUMIFS
- Using SUMIFS() with tables and structural references
- SUMIFS examples – simple, wild card
- Using SUMIFS() with date & time values
- Free sample file for SUMIFS formula
- More formulas for data analysis

Often you may have a set of data and need to know what an intermediate or future value of that data may be.
This week we will investigate 3 methods of tackling this problem using Excel.
In this post we’ll look at manual forecasting.

Here is a little experiment to freak out excel.
Go to cell C3 and write =C3 and press Enter. Excel would throw up nasty message saying, “Microsoft did not know what to do. We have a sent a support engineer to your home, but he is stuck at the round-about near your house.”
Well, not really. But what you did when you wrote the formula =C3 in cell C3 was, you created a circular reference.
A circular reference is created when you refer to same cell either directly or indirectly.
See Mona Lisa, in circular reference style.
Learn more about Excel Circular References, how to use them, examples, how to avoid them, how to deal with them in this article.
Continue »Take your Excel Baby Steps with 89 Minutes of FREE Online Training
I don’t remember when was the last time both of us (Jo and I) were this excited. And the reason?
Nakshatra and Nishanth have started taking their first steps last week !!!
It is such a joy watching them take one step at a time. Aah, the beauty of parenting 🙂
So I asked myself, “What is a good way to celebrate this without looking like a super-excited dad?” and I got my answer in 72 milli-seconds.
I have created 10 short (<10 min) videos helping you to take baby steps in Excel world. Each video introduces you to one new functionality of Excel and shows you some nice examples. Before jumping straight in to the videos, I want to share a short clip (30 seconds) of our kids taking their baby steps.
Continue »How to Check whether a Table is Filtered or not using Formulas

Let us start the week with a simple formula (well, to be fair, let us start the week with a strong cup of coffee, then this formula).
Often when we have large data sets, we apply data filters to select and display only information we want to see.
Some of you know that whenever we apply filters on a dataset, we can look at status bar area to find out if any filter is applied on the current worksheet.
But, what if you need a way to show “filtering” status thru formulas? Like this…,
Continue »How to Convert Text to Dates [Data Cleanup]
![How to Convert Text to Dates [Data Cleanup]](https://chandoo.org/img/f/excel-text-to-date-methods.png)
Sometimes when we import data from another source in to excel, the dates are not imported properly. This can be due to any number of reasons. In this post, we will learn some tricks and ideas you can use to quickly convert text to dates.
Continue »![Making a Dynamic Dashboard in Excel [Part 1 of 4]](https://chandoo.org/img/ed/excel-dynamic-dashboard-final-th.png)
In this and next 3 posts, we will learn how to make a Dynamic Dashboard using Microsoft Excel.
At the end of this tutorial, you will learn how easy it is to set up a dynamic dashboard using excel formulas and simple VBA macros.
Continue »Pivot Table Tricks to Make You a Star

We, data junkies, love pivot tables. We think pivot tables are solution for everything (except for may be global warming and that broken espresso machine down stairs).
Today, we are going to learn 5 awesome pivot table tricks that will make you a star.
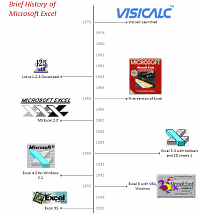
Continue »A Brief History of Microsoft Excel – Timeline Visualization

Timeline charts are great for providing quick snapshots of historical events. And hardly a day goes by without some one making a cool visualization of a time line of this or that. Time lines are easy to read, present information in a logical manner and mostly fun.
So yesterday, I set out to mimic the iconic gadgets of all time in excel, just for fun. Then it strike me, why not make a visual time line of Microsoft Excel ? So I did that instead.
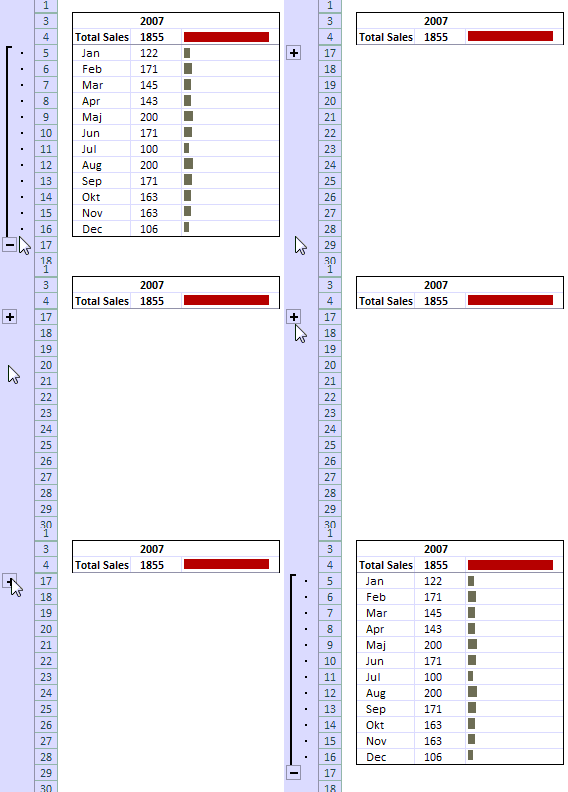
Continue »Collapse, Expand Excel Charts using this hidden trick

Do you know that you collapse or expand excel charts? Don’t believe me? Me neither. When I first realized that we can collapse / expand charts without writing any macros or lengthy formulas, I couldn’t wait to share it with all of you. This is such a simple yet powerful trick. See it for yourself.
The trick lies in using group / un-group data feature and carefully aligning charts with the cell grid. The whole process takes just about 2 minutes and produces wow factor worth a week. Go check it, now. Also, a downloadable template is included in the post.
Continue »Highlighting Repeat Customers using Conditional Formatting [Part 2 of 2]
![Highlighting Repeat Customers using Conditional Formatting [Part 2 of 2]](https://chandoo.org/img/n/repeat-customers-excel-conditional-formatting.png)
This is second part of 2 part series on conditionally formatting dates in excel.
Highlighting Repeat Customers using Conditional FormattingIn yesterday’s post we have learned how to conditionally format dates using excel. In this article, you will learn how to use these conditional formatting tricks to highlight repeat customers in a list of sales records.
Continue »Conditionally Formatting Dates in Excel [Part 1 of 2]
![Conditionally Formatting Dates in Excel [Part 1 of 2]](https://chandoo.org/img/n/conditional-formatting-button.png)
This is first part of 2 part series on conditionally formatting dates in excel.
Conditional formatting is a very useful feature in Excel. You can use Conditional formatting to tell excel how to format cells that meet certain conditions. For eg. You can use conditional formatting to show all negative values in a range in red color. Today we will learn how to use conditional formatting to format dates.
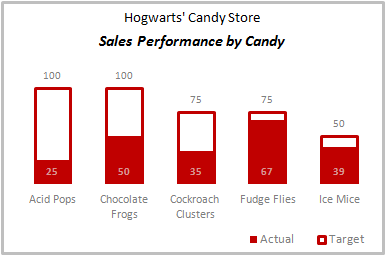
Continue »Make a Quick Thermometer Chart to Compare Targets and Actuals

Comparing values is one of the reasons why we make charts. So today I am going to teach you a handy little trick to make a thermometer like chart to compare targets with actuals. This type of chart is very useful when you have a bunch of sales targets and you want to measure how the performance has been.
Continue »

