All articles with 'top 10 values' Tag
Pivot Tables from large data-sets – 5 examples

Let’s say you are starting at a large dataset with multiple columns. You need to make a pivot report from it for a client or manager. How would you go about it?
Continue »Calculate sum of top 10 values [formulas + homework]
![Calculate sum of top 10 values [formulas + homework]](https://chandoo.org/wp/wp-content/uploads/2015/08/sum-of-top-10-values-excel.png)
Analyzing top n (or bottom m) items is an important part of any data analysis exercise. In this article, we are going to learn Excel formulas to help you with that.
Let’s say you are the lead analyst at a large retail chain in Ohio, USA. You are looking at the latest sales data for all the 300 stores. You want to calculate the total sales of top 10 stores. Read on to learn the techniques.
Continue »How to select a random sample from all your data [trick]
![How to select a random sample from all your data [trick]](https://img.chandoo.org/pivot/how-to-select-random-samples-from-data.png)
The other day, I got a text message (SMS) from one of our readers. It read,
So today, let us learn a very easy trick to select random sample from your data.
Continue »How to find sum of top 3 values based on filtered criteria [video]
![How to find sum of top 3 values based on filtered criteria [video]](https://img.chandoo.org/f/sum-of-top-3-values-meeting-filtered-criteria-excel.png)
Lets say you are looking at some data as shown above and wondering what is the sum of budgets for top 3 projects in East region with Low priority. How would you do that with formulas?
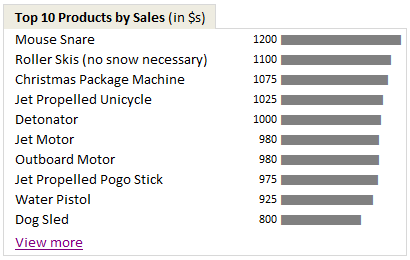
Continue »Show Top 10 Values in Dashboards using Pivot Tables

A good dashboard must show important information at a glance and provide option to drill down for details.
Showing Top 10 (or bottom 10) lists in a dashboard is a good way to achieve this (see aside). Today we will learn an interesting technique to do this in Excel.
Continue »

