All articles with 'reader awesomeness week' Tag
![9 Excel Tips & Downloads Submitted by Our Readers [Reader Awesomeness Week]](https://img.chandoo.org/raw/reader-awesomeness-week.png)
Last week I announced Reader Awesomeness Week to celebrate the passion, attitude and knowledge of our little community here. I got 9 interesting and beautiful entries from our readers. In this post you can see 9 tips & downloads submitted by our readers. These include a project management template, a macro to remove blanks, a technique to make Google Earth maps using Excel and several other interesting tips & tricks.
Go ahead and read them, download attached workbooks and become awesome in Excel. 🙂
Continue »12 Rules for Making Better Spreadsheets

As part of reader awesomeness week, today I am featuring a list that Larry sent me with 12 beautifully defined rules for making better spreadsheets. He says that spreadsheets should be easy to understand, have a clearly defined purpose and should use Excel features as much as possible. I totally agree with him.
Read the rest of this post to find the rules and download a poster containing these rules. Thanks Larry.
Continue »How Francis Landed on Chandoo.org, Become Awesome and Made a Superb Dashboard, all in ONE Weekend
As part of our Reader Awesomeness Week, Francis shares with us a travel site dashboard he made for his company. Francis took just two days to prepare this awesome dashboard which uses concepts like bullet charts, sortable KPI grid, Date based filtering, dynamic charts and more. I was really moved by Francis’ gesture in sharing his work with us, so much that, I did a video review of his work. You can see it in the embedded youtube video to the left.
Read the rest of the article to know how this dashboard is made and get a copy of the file.
Continue »Immigrants in Denmark – An Excel Infographic

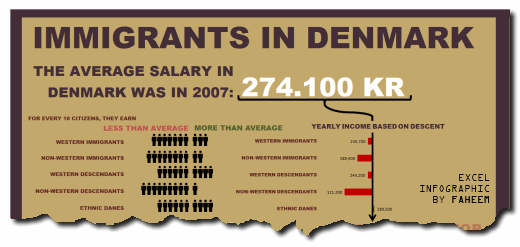
Faheem (@FaheemH) from Denmark sent me this beautiful infographic depicting various facts about Immigrants in Denmark. Immigrants in Denmark – Excel Infographic: [view high res] How is this Info-graphic made? Faheem used a variety of tricks to create this infographic. Some of the key ideas are, Using text boxes and drawing shapes Using bar charts […]
Continue »Announcing Reader Awesomeness Week – Submit your Tips, Stories, Workbooks and Ideas

It is no secret that our readers are awesome. We have tons of creative, passionate & caring members in our community who just kick ass day in day out. Just look at the comments in any post and you are going to find amazing display of skill, intelligence and mastery of Excel craft. To celebrate all this, we are going to dedicate this week (August 2nd thru 6th) as Reader Awesomeness Week.
What is Reader Awesomeness Week?
Through out this week, I am going to share excel workbooks, ideas, tips & tricks that our readers have submitted to me. First 3 days (Tuesday thru Thursday) I will be posting contributions I already received thru Email.
On Friday, I will be posting all the tips, downloads submitted by you. Click here to contribute.
Continue »

