All articles with 'guest posts' Tag
Quarterly & Half-Yearly Profit Loss Reports [Part 5 of 6]
![Quarterly & Half-Yearly Profit Loss Reports [Part 5 of 6]](https://chandoo.org/img/ea/quarterly-half-yearly-profit-loss-reports-excel.png)
This is continuation of our earlier post Exploring Pivot Table P&L Reports.
We have learned how to change our P&L report on various data elements. We have seen how the P&L report can be changed with just few clicks.
In this post we will be learning some grouping tricks in PivotTables. We will cover grouping of dates, text fields and numeric fields. You will need to start with Monthly P&L report prepared in previous post. We will also learn some really clever tricks and hacks on how to group data in Pivot Tables. So read on…,
Continue »![Making a Dynamic Dashboard in Excel [Part 1 of 4]](https://chandoo.org/img/ed/excel-dynamic-dashboard-final-th.png)
In this and next 3 posts, we will learn how to make a Dynamic Dashboard using Microsoft Excel.
At the end of this tutorial, you will learn how easy it is to set up a dynamic dashboard using excel formulas and simple VBA macros.
Continue »Exploring Profit & Loss Reports [Part 4 of 6]
![Exploring Profit & Loss Reports [Part 4 of 6]](https://chandoo.org/img/ea/profit-loss-report-pivot-options-4.png)
This is part 4 of 6 on Profit & Loss Reporting using Excel series, written by Yogesh Data sheet structure for Preparing P&L using Pivot Tables Preparing Pivot Table P&L using Data sheet Adding Calculated Fields to Pivot Table P&L Exploring Pivot Table P&L Reports Quarterly and Half yearly Profit Loss Reports in Excel Budget […]
Continue »Adding Calculated Fields to Pivot Table P&L [part 3 of 6]
![Adding Calculated Fields to Pivot Table P&L [part 3 of 6]](https://chandoo.org/img/ea/profit-loss-report-with-calculated-fields.png)
This is part 3 of 6 on Profit & Loss Reporting using Excel series, written by Yogesh Data sheet structure for Preparing P&L using Pivot Tables Preparing Pivot Table P&L using Data sheet Adding Calculated Fields to Pivot Table P&L Exploring Pivot Table P&L Reports Quarterly and Half yearly Profit Loss Reports in Excel Budget […]
Continue »Preparing Profit / Loss Pivot Reports [Part 2 of 6]
![Preparing Profit / Loss Pivot Reports [Part 2 of 6]](https://chandoo.org/img/ea/profit-loss-reports-2.png)
This is part 2 of 6 on Profit & Loss Reporting using Excel, written by Yogesh Data sheet structure for Preparing P&L using Pivot Tables Preparing Pivot Table P&L using Data sheet Adding Calculated Fields to Pivot Table P&L Exploring Pivot Table P&L Reports Quarterly and Half yearly Profit Loss Reports in Excel Budget V/s […]
Continue »P&L Reporting using Excel [Part 1 of 6 on Excel & Accounting]
![P&L Reporting using Excel [Part 1 of 6 on Excel & Accounting]](https://chandoo.org/img/ea/excel-accounting-pl-reports-1.png)
With this post we are starting a new series on how to do basic accounting in Microsoft Excel. In this and next 5 posts, we will aim to setup Profit & Loss account reporting for multi-location retail company.
During this series we will learn how to make P&L reports on various criteria with just few clicks.
Many users find it difficult to manage their P&L reporting for Multi Location organization.
We will be using Pivot Tables for our reporting purpose and will take example of a Retails chain with multiple locations divided into various regions.
Continue »Data Validation using an Unsorted column with Duplicate Entries as a Source List

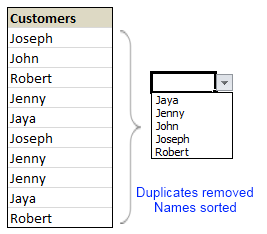
Here is a typical scenario: We want to allow only one of the pre-defined customer names in our spreadsheet. We have listed down all the customers in column B and want excel to check against this list and validate the data. But there are 3 problems. (1) Our list is not sorted alphabetically (2) It contains duplicates and (3) The list comes from external source, so we can not remove duplicates and sort the list every time.
Now how can we set up a simple data validation list that would not repeat customer names and shows them in sorted order like this.
Read the rest of this guest post by Hui to learn how to use data validation in creative new ways.
Continue »![Personal Budget Spreadsheet [Downloads]](https://chandoo.org/wp/wp-content/uploads/2009/11/household-budget-spreadsheet-th.png)
At PHD household, we believe in using money wisely. Both Mrs. PHD and I come from very modest backgrounds. Our upbringing has taught us value of money in the most effective way – by exposing us to not having any. So when we got our first job (did I tell you that both Jo and I started working in same company and sat in same floor? Oh, it was such a lovely time), we were very prudent and decided not to waste money on anything trivial (we still are, just that over last 6 years our earning capacity increased a bit and we became parents).
Anyways, I am not here to bore you about my household. But I am here to tell you fun ways to track expenses and household budgets using spreadsheets.
Continue »Pimp your comment boxes [because it is Friday]
![Pimp your comment boxes [because it is Friday]](https://chandoo.org/img/l/better-comment-box.png)
Excel comment boxes are a very useful feature, but the comment box look hasn’t changed since slice bread. So Tom, one of our readers, took it upon himself to revamp the comment box. He wrote a simple macro to botox, smoothen and color the comment box. It is a fun and simple macro, something that can make a boring spreadsheet friday a little more exciting.
Continue »We cant Cure Cancer, But we can Cure this Medicare Chart [Chart Busters]
![We cant Cure Cancer, But we can Cure this Medicare Chart [Chart Busters]](https://chandoo.org/img/cb/3/Figure_2.png)
In this installment of Chartbusters, we take a look at a poorly constructed choropleth of medicare reimbursements in US and suggest cure for it. The post is from our Guest Buster – Jeff.
Continue »

