All articles with 'guest posts' Tag
Modeling & Building Cash-flow Projections for Project Valuation [Part 4,5 of 6]
![Modeling & Building Cash-flow Projections for Project Valuation [Part 4,5 of 6]](https://chandoo.org/img/fm/modeling-cashflow-projections-project-valuation.png)
In the 4th and 5th part of our financial modeling series, we will learn how to model and build cashflow projections for project valuation.
We will understand the basics behind cash-flow modeling, what kind of non-cash expenses should be added back to get the free cash-flow. You can also get the blank and completed cash-flow projection worksheets to practice these techniques.
Continue »Building Inputs & Assumptions Sheets – Excel Financial Modeling [Part 3 of 6]
![Building Inputs & Assumptions Sheets – Excel Financial Modeling [Part 3 of 6]](https://chandoo.org/img/fm/financial-model-assumptions-inputs.png)
In the third part of our series on Excel Financial Modeling, we teach you how to make an assumptions worksheet to keep track of various investment, working capital and operational assumptions related to project valuation in place.
You can also download the blank worksheet in which you can fill-up assumptions after reading the business case.
Continue »![9 Excel Tips & Downloads Submitted by Our Readers [Reader Awesomeness Week]](https://img.chandoo.org/raw/reader-awesomeness-week.png)
Last week I announced Reader Awesomeness Week to celebrate the passion, attitude and knowledge of our little community here. I got 9 interesting and beautiful entries from our readers. In this post you can see 9 tips & downloads submitted by our readers. These include a project management template, a macro to remove blanks, a technique to make Google Earth maps using Excel and several other interesting tips & tricks.
Go ahead and read them, download attached workbooks and become awesome in Excel. 🙂
Continue »12 Rules for Making Better Spreadsheets

As part of reader awesomeness week, today I am featuring a list that Larry sent me with 12 beautifully defined rules for making better spreadsheets. He says that spreadsheets should be easy to understand, have a clearly defined purpose and should use Excel features as much as possible. I totally agree with him.
Read the rest of this post to find the rules and download a poster containing these rules. Thanks Larry.
Continue »How Francis Landed on Chandoo.org, Become Awesome and Made a Superb Dashboard, all in ONE Weekend
As part of our Reader Awesomeness Week, Francis shares with us a travel site dashboard he made for his company. Francis took just two days to prepare this awesome dashboard which uses concepts like bullet charts, sortable KPI grid, Date based filtering, dynamic charts and more. I was really moved by Francis’ gesture in sharing his work with us, so much that, I did a video review of his work. You can see it in the embedded youtube video to the left.
Read the rest of the article to know how this dashboard is made and get a copy of the file.
Continue »Immigrants in Denmark – An Excel Infographic

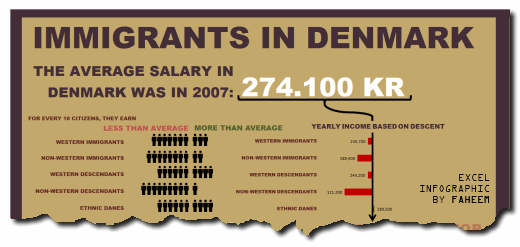
Faheem (@FaheemH) from Denmark sent me this beautiful infographic depicting various facts about Immigrants in Denmark. Immigrants in Denmark – Excel Infographic: [view high res] How is this Info-graphic made? Faheem used a variety of tricks to create this infographic. Some of the key ideas are, Using text boxes and drawing shapes Using bar charts […]
Continue »Building a Layout for Project Evaluation Model & Best Practices [Part 2 of 6]
![Building a Layout for Project Evaluation Model & Best Practices [Part 2 of 6]](https://chandoo.org/img/fm/financial-model-layout-best-practices.png)
In the second part of our tutorial we will learn how to prepare the layout of our model to do project evaluation.
If you know basic referencing and formula framework in excel, you can write a model that calculates numbers. Good vs Bad financial model would be decided by the layout of the model.
Before we start discussing on how to build a good layout, lets see the layout that I have in mind. The layout is based on my experience of working as an investment banker and as a consultant and I find it neat.
Continue »How to show Indian Currency Format in Excel?

This is a guest post by our excel ninja – Hui. Today we will learn how to format numbers and amounts in Indian currency format. Indian numbers are grouped differently than standard English numbers. English Grouping 123,456,789.01 Indian Grouping 12,34,56,789.01 Quick and easy fix to show numbers in Indian format: A custom number format of: […]
Continue »![Introduction to Financial Modeling using Excel [Part 1 of 6]](https://chandoo.org/img/fm/financial-modeling-excel.png)
In this and next 5 posts, we are going to learn how to build a financial model to do project evaluation using Excel. The 6 parts of this tutorial are,
- Introduction to Financial Modeling
- Building a layout for Project Evaluation Model – Best practices
- Building Inputs and Assumptions Sheet
- Building Projections for Project Evaluation
- Modeling the Cash Flow Statement and Projections
- Putting it all together – Final Project Evaluation Model
What is financial modeling?
Financial modeling is creating a complete program/ structure, which helps you in coming to a decision regarding investment in a project/ company. Now this could be on a simple piece of paper or in excel. The advantage with excel is that, even if you have calculation speed and accuracy like me (this is one place where I am like Einstien!), then also you would be able to come to the right conclusion!
Continue »Get Stock Quotes using Excel Macros [and a Crash Course in VBA]
![Get Stock Quotes using Excel Macros [and a Crash Course in VBA]](https://img.chandoo.org/vba/stock-quotes-in-excel-macro.png)
Have you ever wanted to fetch live stock quotes from excel? In this post we will learn about how to get stock quotes for specified symbols using macros. We use Yahoo! Finance API to fetch the stock quotes and other information related to a company using excel macros. Along the way, we will also learn various interesting things about Excel VBA. Think of this post as a crash course in VBA.
This is a guest post by Daniel Ferry.
Continue »Dynamic Dashboard in Excel – Pulling it all together [Part 4 of 4]
![Dynamic Dashboard in Excel – Pulling it all together [Part 4 of 4]](https://chandoo.org/img/ed/excel-dynamic-dashboard-final-th.png)
In the last installment of our dynamic dashboard tutorial, we will take all that we have learned in first 3 parts and combine that to create a final dashboard. We are going to use concepts like table of contents, macros and data validation to help us get ahead. You can find the entire macro and downloadable workbook inside the post. Read on…
Continue »Data Tables & Monte Carlo Simulations in Excel – A Comprehensive Guide

If anybody asks me what is the best function in excel I am drawn between Sumproduct and Data Tables, Both make handling large amounts of data a breeze, the only thing missing is the Spandex Pants and Red Cape!
How often have you thought of or been asked “I’d like to know what our profit would be for a number of values of an input variable” or “Can I have a graph of Profit vs Cost”
This post is going to detail the use of the Data Table function within Excel, which can help you answer that question and then so so much more.
Continue »Making a Dynamic Dashboard in Excel [Part 3 of 4]
![Making a Dynamic Dashboard in Excel [Part 3 of 4]](https://chandoo.org/img/ed/moving-objects-with-vba.gif)
In this post we are going to look at a simple example of the VBA behind the Dynamic Dashboard. Essentially we will learn to write macros for doing this. Read the rest of this post to find code samples and downloadable files to play with.
Continue »Budget vs. Actual Profit Loss Report using Pivot Tables

This is continuation of our earlier post Preparing Quarterly and Half yearly P&L using grouping option. You can also do budget v/s actual comparison using Pivot Tables. For this we will use calculated items feature of Excel PivotTables.
To begin, we have to add one more column to our data. I have added column Data Source to the end of data table. Existing data is marked as Actual and I have added more data rows which are marked as Budget. You can download new file with updated data and basic Pivot P&L.
Continue »Making a Dynamic Dashboard in Excel [Part 2 of 4]
![Making a Dynamic Dashboard in Excel [Part 2 of 4]](https://chandoo.org/img/ed/excel-dynamic-dashboard-final-th.png)
In part 2 of Excel Dynamic Dashboard Tutorial, we will learn how to set up various dynamic charts that are part of the dashboard. We start with a simple dynamic pie chart that shows the sales distributions and then move on to sales trend line charts. These charts use various excel formulas to pull in the information based on user selection.
Continue »

