All articles with 'fun' Tag
What is the most unusual thing you have used Excel for? [Quick Poll]
![What is the most unusual thing you have used Excel for? [Quick Poll]](https://chandoo.org/img/polls/unusual-uses-of-excel.png)
Ok. This is quick and short. What is the most weird, unusual, out of the world thing you have used excel for?
I have used excel to generate and clean a list of tags for this blog, to keep track of which movies I have seen in the IMDb Top 250 list, to simulate monopoly board game, just so I can play it better than my wife 😉 etc.
What about you? Share using comments.
Continue »
Dilbert is my favorite cartoon (Calvin & Hobbes comes second). I like it so much that I have named this blog after Dilbert. So, today, as as ode to Dilbert and all things excel, we present you… Dilbert on Excel. Read the rest of this post to find some great dilbert strips on excel modeling, formulas, errors and annoyances. Have a fun weekend.
Continue »RSS Icon using Donut Charts – Because it is Weekend
RSS Icon using Donut Charts – Because it is Weekend
Continue »Creating Excel Art from Images [spreadsheet fun]
![Creating Excel Art from Images [spreadsheet fun]](https://chandoo.org/wp/wp-content/uploads/2008/12/cell-art-image-thumb.png)
Amit at Digital Inspiration features a lengthy way of creating beautiful excel cell art from an image. I guess we all can use a method that is little simpler and smarter.
Continue »Google Spreadsheets Holiday Art Template

This is pure fun! Few Googlers used the collaborative feature in Google Spreadsheets to create a holiday art template with snow flakes using 18 colors. Each of them added few colors on a blue canvas to create this massive template. The best part is they even made a time lapse video of the whole process […]
Continue »
Yesterday I have learned this cool excel charting trick and I cant wait to share it with you all. The problem: I have too many charts & want to show one based on selection You have made 3 charts to show your company performance in the last 8 years. But you don’t want to clutter […]
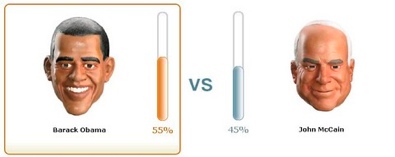
Continue »Red vs. Blue – 35 Cool Visualizations on 2008 US Presidential Election

With 2008 US Presidential elections around the corner everyone is busy including chart makers. There are hundreds of excellent visualizations on the presidential election campaign, speeches, issues, predictions that keeping track of what is best can be a tough task. We at PHD have compiled a list of 35 totally awesome visualizations on the 2008 […]
Continue »Deal or No Deal – Download and Play the Popular TV Game Show in Excel

Ever since we moved to Seattle we have been watching TV game show – Deal or No Deal (for lack of better things to do in the hotel) The game provides an interesting look at human nature and risk taking abilities. People who wouldn’t risk their retirement savings or jobs would go to these game […]
Continue »Visualizing Sex & Love – 10 Infographics You Must See

Dont think of me as a perverted spreadsheet user, I like visualizations in any form or shape. There is so much data even about human relationships like love and sex. This article shows 10 of the most visually beautiful and insightful of the infographics on sex and love. Click on the titles above images to […]
Continue »The new Microsoft “Hi, I am PC” ads are supercool. Apple has been making fun of PC (and PC users) for while with the “I am PC, I am Mac” ads and the response from MS advertising team is nothing short of brilliant. With these simple & funny ads, they have changed the focus from […]
Continue »![Cool Info-graphics of the Week [Sep 5]](https://chandoo.org/wp/wp-content/uploads/2008/09/anatomy-of-a-great-speech-obama-acceptance-dnc.jpg)
Once every week Pointy Haired Dilbert celebrates the art of chart making by sharing 4-5 of the best info-graphics featured in various web sites. Click here to see the visualizations featured earlier. Anatomy of a Great Speech – Obama’s acceptance speech at DNC Presentation Zen captures Obama’s symphony like acceptance speech in a graph shown […]
Continue »My polar clock using donut charts in excel started a conversation and readers have been awesome enough to download the excel and create their own clocks to show time. Even though the idea of this blog is share the little that I know with you, it is amazing how much I have learned from you […]
Continue »![Polar clock using donut chart [Excel Visualization fun]](https://chandoo.org/wp/wp-content/uploads/2008/08/donut-clock-in-excel-thumb.png)
Smashing Magazine is one of daily hangouts for new design ideas, inspiration and ogle fun. When they featured Pixel Breaker’s Polar clock last Friday on Top 10 creative ways to display time, I knew this could be an interesting visualization to do in excel. So I have created a donut chart in excel that can […]
Continue »Excel can be Exciting – 15 fun things you can do with your spreadsheet in less than 5 seconds

Who said Excel takes lot of time / steps do something? Here is a list of 15 incredibly fun things you can do to your spreadsheets and each takes no more than 5 seconds to do. Happy Friday 🙂 1. Change the shape / color of cell comments Just select the cell comment, go to […]
Continue »Environmental Graffiti should get the award for “worst possible bar chart ever” for this unbelievable piece of art… Who said bar charts are only for serious data interpretation, they can be used to have such fun 🙂 Also read Garr Reynold’s comments on this as well. Happy Thursday.. 🙂
Continue »

