All articles with 'Learn Excel' Tag
{ 8 Comments }
Transpose Excel Rows and Columns [Quick Tip + Video]
Published on Nov 18, 2009 in Excel Howtos, Learn Excel
![Transpose Excel Rows and Columns [Quick Tip + Video]](https://chandoo.org/img/i/transpose-rows-columns.png)
Transposing rows and columns in a table is one of the most useful tricks when you are pasting data. Yet, it always surprises me that very few people actually know this. So here it is…
Continue »{ 115 Comments }
Grouping Dates in Pivot Tables
Published on Nov 17, 2009 in Learn Excel, Pivot Tables & Charts
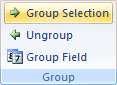
Do you know you can group dates in pivot tables to show the report by week, month or quarter? I have learned this trick while doing analysis on a pivot table today. In this online lesson on pivot tables, I will teach you how to group dates in pivot tables to analyze the data by month, week, quarter or hour of day.
Continue »{ 3 Comments }
Excel Links of the Week [Excel Dashboards Edition]
Published on Nov 16, 2009 in excel links
Over the weekend I spent some time to update the Excel Dashboards page. It now features more articles, downloads and resources for those of you making Excel Dashboards. Go ahead and check out the page here and let me know your feedback.
Moving on to this weeks excel and charting links worth checking.
Continue »{ 7 Comments }
What is the most embarrassing charting mistake you made? [weekend poll]
Published on Nov 13, 2009 in Charts and Graphs
![What is the most embarrassing charting mistake you made? [weekend poll]](https://chandoo.org/wp/wp-content/uploads/2008/10/making-sports-dashboards-in-excel-sml.png)
This week’s poll is very simple. What is the the most embarrassing charting mistake your made?
For me it has to be that one time when I made a sports dashboard using excel. I have adjusted the axis scale of a bar chart so that my favorite cricket player (Sachin Tendulkar, who else?)’s records are emphasized. In a matter of minutes I have received several comments from all over world pointing out the mistake. Even though, the intention was to highlight the achievements of master blaster, the axis adjustment was obviously a mistake.
Continue »{ 63 Comments }
Chart this Sales Data and get an iPod Touch [Visualization Challenge #2]
Published on Nov 11, 2009 in Charts and Graphs
![Chart this Sales Data and get an iPod Touch [Visualization Challenge #2]](https://chandoo.org/img/cb/ipod-touch-8gb.png)
Here is a challenge many people face. How to make a chart visualizing sales data with several dimensions like product, brand, region, sales person name, year (or month or quarter) and one or two values like sales, # of units sold, profits, # of new customers.
In visualization challenge #2, all you have to do is a make a chart or dashboard to visualize this sales data effectively.
Continue »{ 254 Comments }
What is Excel SUMPRODUCT formula and how to use it?
Published on Nov 10, 2009 in Featured, Learn Excel
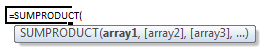
Today we will learn a new and exciting excel formula – the all powerful SUMPRODUCT.
At the outset SUMPRODUCT formula may not seem like all that useful. But once you understand how excel works with lists (or arrays) of data, the SUMPRODUCT’s relevance becomes crystal clear.
Continue »{ 1 Comment }
Excel Links of the week [After a long time edition]
Published on Nov 9, 2009 in excel links
It has been a really long time since we have an excel links post here. That doesnt mean I am not reading anything exciting. It is just that I have gotten busy being a dad. But now that I am in to a saner schedule, we are bringing back the excel links. Here is a […]
Continue »{ 30 Comments }
Lets Pimp a Gauge Chart [Chart Porn Friday]
Published on Nov 6, 2009 in Charts and Graphs
![Lets Pimp a Gauge Chart [Chart Porn Friday]](https://chandoo.org/wp/wp-content/uploads/2009/11/fancy-excel-gauge-chart-th.png)
Egil, one of our alert readers from Norway sent this to me in e-mail, which I swear, I am not making up – A Fancy Gauge Chart. See the e-mail and chart yourself. I’m having a lot of fun with your gauge template 🙂 To make it more industrial-like, I’ve added: 1. Brushed metal background […]
Continue »{ 4 Comments }
Product Recommendation – Excel Lookup Toolbox
Published on Nov 5, 2009 in Learn Excel, products
Anyone working on the data using excel will know the importance of lookup formulas. They are vital for making almost any spreadsheet or dashboard. That is why when my friend John Franco, who maintains Excel-Spreadsheet-Authors.com, wrote to me about his new book Excel lookup toolbox I was truly excited. In this post I am going to share my review of this product.
Continue »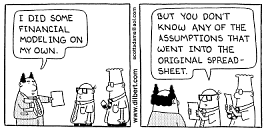
We all have atleast one story of how that one time the boss / co-worker / classmate / cat ruined the carefully crafted excel spreadsheet by mucking up the formulas or disturbing the formatting. Read this post to learn 10 awesome excel tips to make better and boss-proof excel sheets.
Continue »{ 19 Comments }
Switch Rows and Columns in Charts [Quick Charting Tip]
Published on Nov 2, 2009 in Charts and Graphs, Excel Howtos
![Switch Rows and Columns in Charts [Quick Charting Tip]](https://chandoo.org/img/c/switch-rows-columns-in-charts.png)
Let us say you have built a nice chart showing your sales and profits for the top 5 products (learn how to highlight top 5 products in a list), with products on X axis. Suddenly your boss wants to switch the rows to columns (or transpose the chart) so that she can see metric level grouping instead of product level grouping. No need to freak out and rush to Espresso machine, You can do it very easily with Excel Charting features.
In today’s quick tip you will learn how to swap chart rows and columns in excel.
Continue »
Yesterday I read about interaction plots on junk charts where he points out the merits of an interaction plot. Interaction plots show interaction effects between 2 factors. For eg. you can show how your product sales have changed between year 1 and year 2 using an interaction plot like the one shown aside.
Continue »{ 11 Comments }
Copy Data Validations from one cell to another [quick tip]
Published on Oct 28, 2009 in Excel Howtos
![Copy Data Validations from one cell to another [quick tip]](https://chandoo.org/img/i/copy-data-validations.png)
If only there is paste special for everything in life, things would be much more smoother and fun. Alas, the paste special is limited only to excel.
Here is a handy trick you can use to quickly scale up data validations set up in one cell to say a range of cells.
Just copy the cell by pressing CTRL+C and then go to the target cell(s) and press ALT+ESN. And your data validations are pasted in the new cells. That is all. Quick and Easy.
Continue »{ 7 Comments }
Project Dashboard + Tweetboard = pure awesomeness!!!
Published on Oct 27, 2009 in Charts and Graphs
Check out an implementation of project dashboard along with tweetboard by our reader Fernando. He says, it “turned out to be a great success”. I am so happy for him.
Btw, the post includes a link to download the workbook so that you can see the dashboard and tweetboard in action.
Continue »{ 42 Comments }
Prevent Duplicate Data Entry using Cell Validations
Published on Oct 26, 2009 in Excel Howtos

We all know that data validation is a very useful feature in Excel. You can use data validation to create a drop-down list in a cell and limit the values user can enter. But, do you know that you can use data validation in a multitude of ways to prevent users from entering wrong data?
Here is a practical application: Prevent users from entering duplicate values in a range of cells.
For eg. you are making an invoice. Wouldn’t it be cool if Excel prompted you when you enter a duplicate line item so that increase the item quantity instead of repeating it.
Continue »
