All articles with 'Excel Tips' Tag
Weekly Excel Links – Issues with Hosting of PHD
Over the weekend I got thinking about the various ways in which PHD can help you and I wonder if PHD should have forums. For one, forums are a great way to discuss ideas, find answers and develop community feeling. But at the same time, there are tons of very good excel forums that having another one may not really help. Currently I am leaning towards starting a forum to see how it goes. What do you think I should do ?
Continue »
Happy New Year to all my readers. I am sure 2008 has been many things to many people, but I am hoping it has been an year of productivity and happiness for you. Here is to wishing a great, no, fantastic 2009 for you and your family.
Continue »
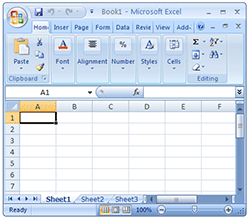
After a really long wait finally I have used … Excel 2007 (drum roll) and contrary to what many people think, I have found Excel 2007 to be a very well designed piece of software. Of course there are various issues with it and I am sure folks at MS are working on them so that next versions of MS Office are much more pleasant and simpler to use.
I wanted to share 10 wow factors in Excel 2007 that may convince you to try it.
Continue »Finally I have got internet connection at home. The folks at Airtel Broadband are very fast and professional. They set up the connection in very few days. So I will be able to blog regularly from now on.
Moving to this week’s excel links you should browse;
Continue »
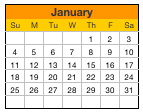
Free excel calendar template for year 2009 (well, it works for any year all the way up to 9999)
Go ahead and download it, change the year number in the first sheet to 1981 or something and see the magic.
Continue »Tomorrow is thanksgiving day here. It is a harvest festival on which people express thanks for what they have. Much like Sankranthi (pongal) in India. At this moment I am very angry and frustrated about the terror strikes in Mumbai. I am not sure how a person can do something like this to others. I […]
Continue »
One of the most common comments we get here is “how does xxx formula works?” Even though there is vast documentation on excel formulas including the built-in help in MS Office, often it is difficult for us to learn a formula quickly and use it in a snap. So to help new users of excel […]
Continue »
Often when you are writing code or testing an application, it might be helpful to have random phone numbers generated for you. Here is an excel formula that I use: =value(left(substitute(rand(),”0.”,””),10)) try these 2 instead (thanks to John) =RAND()*(9999999999-1000000000)+1000000000 =RANDBETWEEN(1000000000,9999999999) [needs analysis toolpack add-in or excel 2007] Even though it works most of the time […]
Continue »Extracting Unique, Duplicate and Missing Items using Formulas [spreadcheats]
![Extracting Unique, Duplicate and Missing Items using Formulas [spreadcheats]](https://chandoo.org/wp/wp-content/uploads/2008/11/duplicate-items-excel-formula-find.gif)
Often I wish Microsoft had spent the effort and time on a data genie (and a set of powerful formulas) that can automate common data cleanup tasks like extracting duplicates, makings lists unique, find missing items, remove spaces etc. Alas, instead they have provided features like clippy which are intrusive to say the least. So […]
Continue »Best of Pointy Haired Dilbert – Oct 2008
October has been another fantastic month since I stared this blog. We had 100k page views, the RSS subscriber count nearly touched 1500. There were 33 posts and 280 comments (WOW). Even our Facebook fan club reached the milestone of 10 members. For a loooong time myself and a friend whom I persuaded to join […]
Continue »![Adding Box Plots to Show Data Distribution in Dashboards [Part 6 of 6]](https://chandoo.org/wp/wp-content/uploads/2008/10/box-plot-excel-dashboard-visualization-thumb.png)
This is a Guest Post by Robert on Visualization Techniques for Excel KPI Dashboards. This 6 Part Tutorial on Management Dashboards Teaches YOU: Creating a Scrollable List View in Dashboard Add Ability to Sort on Any KPI to the Dashboard Highlight KPIs Based on Percentile Add Microcharts to KPI Dashboards Compare 2 KPIs in the […]
Continue »
Sorting text is such a day to day activity that it always surprises me why Excel hasn’t provided a simple spreadsheet formula for doing it. Of course you can use the sorting menu command (menu > data > sort) but this requires manual steps (or VBA). Most of the times we get raw textual data […]
Continue »Sports Dashboards in Excel – A Tutorial

One of my favorite cricket player, the GOD – Sachin Tendulkar has become highest test run scorer. What do I get if Sachin becomes highest scorer, you may ask. In order to celebrate this occasion I have created a cool sports dashboard in excel with some of the top test cricket players’ statistics. And, you […]
Continue »More than 3 Conditional Formats in Excel

One of the most popular posts on this blog is how to become excel conditional formatting rock star. Quite a few commenters there asked me if there is a way to get more than 3 (or 4) conditional formats in excel 2003. Like what you see below: You can get more than three conditional formats […]
Continue »![KPI Dashboards – Compare 2 Decision Parameters [Part 5 of 6]](https://chandoo.org/wp/wp-content/uploads/2008/10/excel-dashboard-visualization-tips-thumb.png)
This is a Guest Post by Robert on Visualization Techniques for KPI Dashboards using Excel. This 6 Part Tutorial on Management Dashboards Teaches YOU: Creating a Scrollable List View in Dashboard Add Ability to Sort on Any KPI to the Dashboard Highlight KPIs Based on Percentile Add Microcharts to KPI Dashboards Compare 2 KPIs in […]
Continue »

