All articles with 'downloads' Tag
{ 59 Comments }
Excel Basics – What are Combination Charts and How to Make One?
Published on Jan 5, 2009 in Charts and Graphs, Learn Excel
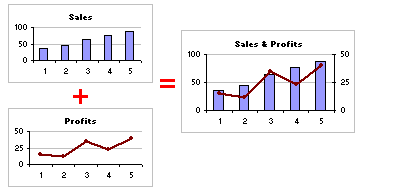
A combination chart is when you combine two different charts to make one. A popular example for combination chart is a line & bar graph combination.
Continue »{ 12 Comments }
2009 Calendar Template in Excel – Now with week starting on Monday
Published on Dec 16, 2008 in Learn Excel

Stružák, one of the commenters on the 2009 Excel Calendar Template post asked me if I can rearrange the cells in the calendar so that the week could start on Monday. Since I didn’t have access to internet for a while, I have asked him to make the necessary changes and mail it to me […]
Continue »{ 6 Comments }
Brick Charts in Excel – an Alternative to Gridlines
Published on Dec 10, 2008 in Charts and Graphs, Learn Excel
Grid lines provide great help in understanding values in a chart. Here is a handy trick you can use in the next bar chart to spice it up. Here is how you can get this type of chart (we will call it a brick chart) First we will make a regular bar chart Now, let […]
Continue »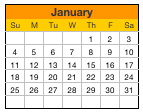
Free excel calendar template for year 2009 (well, it works for any year all the way up to 9999)
Go ahead and download it, change the year number in the first sheet to 1981 or something and see the magic.
Continue »{ 113 Comments }
Advanced Data Validation Techniques in Excel [spreadcheats]
Published on Nov 25, 2008 in Learn Excel
![Advanced Data Validation Techniques in Excel [spreadcheats]](https://chandoo.org/wp/wp-content/uploads/2008/11/data-validation-change-lists.png)
Data validation is a great way to keep your users informed about possible values in a cell and guide them to select something appropriate. As part of the spreadcheats series, in this post we will discuss 2 advanced data validation techniques that can help you when you are modeling a complex worksheet.
Continue »{ 4 Comments }
Excel Links of the Week – All Downloads at One Place Edition
Published on Nov 10, 2008 in excel links

25+ Excel Templates – Download and Use [plug] Have you ever wondered what it would be like to get all the excel downloadables in Pointy Haired Dilbert in one simple page? Well, I did and created this simple excel templates – download page. It has 27 templates currently and I will add more as and […]
Continue »{ 18 Comments }
Extracting Unique, Duplicate and Missing Items using Formulas [spreadcheats]
Published on Nov 6, 2008 in Analytics, Learn Excel
![Extracting Unique, Duplicate and Missing Items using Formulas [spreadcheats]](https://chandoo.org/wp/wp-content/uploads/2008/11/duplicate-items-excel-formula-find.gif)
Often I wish Microsoft had spent the effort and time on a data genie (and a set of powerful formulas) that can automate common data cleanup tasks like extracting duplicates, makings lists unique, find missing items, remove spaces etc. Alas, instead they have provided features like clippy which are intrusive to say the least. So […]
Continue »
Yesterday I have learned this cool excel charting trick and I cant wait to share it with you all. The problem: I have too many charts & want to show one based on selection You have made 3 charts to show your company performance in the last 8 years. But you don’t want to clutter […]
Continue »![Adding Box Plots to Show Data Distribution in Dashboards [Part 6 of 6]](https://chandoo.org/wp/wp-content/uploads/2008/10/box-plot-excel-dashboard-visualization-thumb.png)
This is a Guest Post by Robert on Visualization Techniques for Excel KPI Dashboards. This 6 Part Tutorial on Management Dashboards Teaches YOU: Creating a Scrollable List View in Dashboard Add Ability to Sort on Any KPI to the Dashboard Highlight KPIs Based on Percentile Add Microcharts to KPI Dashboards Compare 2 KPIs in the […]
Continue »{ 20 Comments }
Sports Dashboards in Excel – A Tutorial
Published on Oct 20, 2008 in Charts and Graphs, Learn Excel

One of my favorite cricket player, the GOD – Sachin Tendulkar has become highest test run scorer. What do I get if Sachin becomes highest scorer, you may ask. In order to celebrate this occasion I have created a cool sports dashboard in excel with some of the top test cricket players’ statistics. And, you […]
Continue »{ 32 Comments }
More than 3 Conditional Formats in Excel
Published on Oct 14, 2008 in Charts and Graphs, Learn Excel

One of the most popular posts on this blog is how to become excel conditional formatting rock star. Quite a few commenters there asked me if there is a way to get more than 3 (or 4) conditional formats in excel 2003. Like what you see below: You can get more than three conditional formats […]
Continue »![KPI Dashboards – Compare 2 Decision Parameters [Part 5 of 6]](https://chandoo.org/wp/wp-content/uploads/2008/10/excel-dashboard-visualization-tips-thumb.png)
This is a Guest Post by Robert on Visualization Techniques for KPI Dashboards using Excel. This 6 Part Tutorial on Management Dashboards Teaches YOU: Creating a Scrollable List View in Dashboard Add Ability to Sort on Any KPI to the Dashboard Highlight KPIs Based on Percentile Add Microcharts to KPI Dashboards Compare 2 KPIs in […]
Continue »
In Petal Charts – an Alternative to Radar Charts I have suggested using a radar chart tweak to replace the radar charts. Both PTSBlog and Information Ocean have posted their critical reviews of these petal charts. So as a penance for proposing petals, I am going to provide a tutorial on creating a comparison table […]
Continue »{ 8 Comments }
Deal or No Deal – Download and Play the Popular TV Game Show in Excel
Published on Oct 3, 2008 in Learn Excel, simulation
Ever since we moved to Seattle we have been watching TV game show – Deal or No Deal (for lack of better things to do in the hotel) The game provides an interesting look at human nature and risk taking abilities. People who wouldn’t risk their retirement savings or jobs would go to these game […]
Continue »{ 21 Comments }
Simple Todo List application using Excel – Download and become productive
Published on Oct 1, 2008 in Learn Excel

After seeing Andrew’s simple excel based check-list I got this idea of preparing a simple To-Do list application using excel. Since most of us use Excel on day to day basis, why not use it as a productivity application as well by keeping track of all the things we must do (TO DO List). When […]
Continue »
