All articles with 'downloads' Tag

How often have you had a simple table where you want to lookup a value or add up some values meeting a criteria?
This post looks at a simple way to do a 2D Lookup or 2D Sum of a values from within a 2D range with multiple criteria, without complex Sum, Offset, Index, Match, Sumifs or other functions, simply using Sumproduct
Continue »{ 17 Comments }
Mod() function in excel to Implement Escalation Frequency [Financial Modeling Tutorials]
Published on May 24, 2011 in Financial Modeling, Learn Excel
![Mod() function in excel to Implement Escalation Frequency [Financial Modeling Tutorials]](https://chandoo.org/wp/wp-content/uploads/2011/04/EscalationFrequency.gif)
You take an apartment on rent at $1000 per month and the owner puts an escalation clause saying 10% increment each 3 years. How do you model this in excel? In this tutorial we understand how escalations at certain frequency can be implemented using the mod function in excel. What is the mod() function Simply […]
Continue »{ 4 Comments }
VBA Classes Registration Closing in a Few Hours – Join Now!
Published on May 20, 2011 in Charts and Graphs, VBA Macros
I have a quick announcement for you.
Registrations for our VBA Class will be closing in a few hours
As you may know, we have opened registrations for our first batch of Online VBA classes on May 9th. This program is aimed at beginners & intermediate level VBA users. The aim of this course is to make you awesome in VBA. We will be closing registrations for this program in few more hours (exactly at 11:59 PM, Pacific time, on 20th May 2011)
Click here to join our VBA Class now.
Continue »{ 15 Comments }
Count-down Timer App in VBA to Remind you about the VBAClasses Closing Time!!!
Published on May 18, 2011 in products, VBA Macros
Here is a cool count-down timer application made in VBA to remind you about our VBAClasses registration closing time!
Read the rest of this post to learn how this particular app is built.
If you want to learn VBA, then click here to join our class.
Continue »{ 18 Comments }
Introduction to Programming – Demo Lesson from our VBA Class
Published on May 13, 2011 in VBA Macros
We have a challenge in our VBA class. Many of the students who join our VBA program have no formal programming background. They may have written a few simple programs long time ago, but most of them lack basic understanding of programming. Teaching VBA can be difficult if we do not address this problem.
So, we have added a lesson on “Introduction to Programming”. In this lesson, our aim is to introduce programming to non-programers.
Since many of you are considering to join our VBA classes, it is appropriate that we give this introduction to programming lesson as a demo lesson. Please watch it below.
Continue »{ 6 Comments }
5 things you should know about VBA Classes + a Demo Lesson
Published on May 6, 2011 in products, VBA Macros
Today, I want to quickly share a few things about the upcoming VBA Classes.
I have been running online training programs since Jan, 2010. I have trained more than 900 students till date. Still, whenever I am launching a new program, I could feel that familiar sense of eagerness, tension and tremendous enthusiasm building up. I feel eager because I want to meet you, teach you and learn from you. I feel tensed because I want to do it right. I feel enthusiastic because these training programs give me a lot of new ideas and open-up new possibilities.
Continue »{ 10 Comments }
Online VBA Classes by Chandoo.org – Details & Dates
Published on May 2, 2011 in products, VBA Macros
Few days ago, I have asked you, Do you want to learn Excel VBA online? and many of you said YES. So we are starting the program, on next Monday – 9th of May.
VBA Classes is a 12 week online training program that will explain various Excel VBA concepts to you in an easy to understand format. Just like Excel School, we will keep this fun, exciting, interactive and useful. We will learn from each other as much as we learn from this course. To help you understand how this course works, we made a small video. You can watch it and get other details about the program in this post.
Continue »
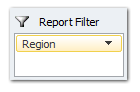
Last week, we have learned what Pivot Table Report Filters are & how to use them.
Today, I am going to show, how you can use simple macro code to change the report filter value dynamically.
We will learn how to create the chart shown here.
Continue »{ 15 Comments }
Comparing Sales of One Product with Another [Excel Techniques]
Published on Apr 25, 2011 in Charts and Graphs
![Comparing Sales of One Product with Another [Excel Techniques]](https://img.chandoo.org/c/comparing-sales-of-one-product-with-another-demo.png)
This is a guest article by Theodor on how to Compare Sales of One Product with Another
Ok, now here’s one for you.
Suppose you’d like to come up with a sales report on different products, comparing their evolution on the same period of different years (say Jan ’09 vs. Jan Jan ’10). At the same time, you’d like to keep an eye on their yearly trend (entire 2009 vs. entire 2010).
Read on to learn how you can use Excel Charts to do this very easily.
Continue »{ 32 Comments }
What are Pivot Table Report Filters and How to use them?
Published on Apr 20, 2011 in Pivot Tables & Charts
Today we will learn about Pivot Table Report Filters.
We all know that Pivot Tables help us analyze and report massive amount of data in little time. Excel has several useful pivot table features to help us make all sorts of reports and charts.
Report Filters are one such thing.
Continue »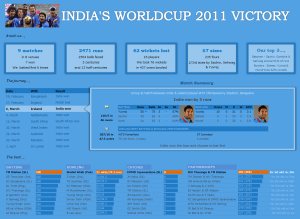
I know I am late to the party, but better late than…, uh! forget it.
As the keen readers of our blog knew, I like cricket and I show my enthusiasm by making an excel dashboard (or info-graphic) whenever Indian team reaches a major milestone. So naturally, I was super excited when we won the ICC World cup 2011. Last time Indian won the event was in 1983 and my idea of a dashboard at that time was a bottle of milk and jingo-bell, my favorite shake-to-make-annoying-noise toy. I think our latest world-cup victory deserves something more than that. So here we go.
Continue »
How to make a 5 Star Chart (Similar to Amazon)
Last week Chandoo presented Give more details by showing average and distribution
At the top of the post was a small screen capture from Amazon.com showing a 5 Star chart showing that Twilight had a 3.5 Star Rating (way over-rated if you ask me).
I received an email shortly afterwards from Rajiv, “How can I make one of those charts ? ” with the Stars Circled
It’s actually very simple and this post will show you how.
Continue »![Show Details On-demand in Excel [Tutorial + Training Program]](https://img.chandoo.org/c/on-demand-analysis-and-details-in-excel-demo.gif)
Yesterday, we have seen a beautiful example of how showing details (like distribution) on-demand can increase the effectiveness of your reports. Today, we will learn how to do the same in Excel.
Continue »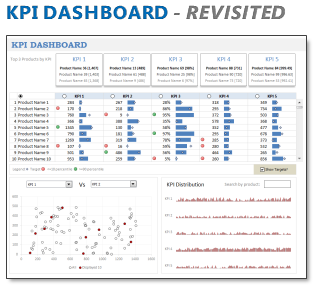
In 2008, I received an email from Robert Mundigl, which was the start of a life-long friendship. Robert asked me if he can teach us how to make KPI dashboards using Excel. I gladly said yes because I am always looking for new ways to use Excel.
The original KPI dashboards using Excel article was so popular. They still help around 12,000 people around the globe every month. Many of our regular readers and members have once started their journey on Chandoo.org from these articles.
In this article, we will revisit the dashboard and give it a fresh new spin using Excel 2007.
Continue »{ 8 Comments }
Executive Review Dashboard in Excel [Dashboard Week]
Published on Mar 23, 2011 in Charts and Graphs
![Executive Review Dashboard in Excel [Dashboard Week]](https://chandoo.org/img/dashboards/dw/executive-review-dashboard-in-excel.png)
Purpose of the dashboard:
This is a guest article written by John for our Excel Dashboard Week.
This Dashboard was constructed for a number of reasons, one of which was to reduce the number of reports produced with the same data ( up to 6 separate files ). As we all know, when it comes to senior management and reports / files the more information they can get on one report / file the better for them. So, with this in mind I created the Dashboard to show the data they need to see “quickly” each week.
Continue »
