All articles with 'advanced excel' Tag
CP040: Intro. to Power Query – What is it and how to get started – with Miguel Escobar

Podcast: Play in new window | Download
Subscribe: Apple Podcasts | Spotify | RSS
In the 40th session of Chandoo.org podcast, Let’s talk about Power Query. I have the pleasure and fortune to catch up with Miguel Escobar (who along with Ken Puls runs PowerQuery.Training website) and talk about this very exciting piece of technology and how it can make our life simpler.
What is in this session?
In this podcast,
- Welcome
- Miguel’s introduction, background and current projects
- What is Power Query
- How to install it
- Sample use cases of Power Query
- What is Power BI
- Resources for learning Power Query – Books & Courses
CP039: May the FOR Loop be with you – Introduction to For Loops in Excel VBA
Podcast: Play in new window | Download
Subscribe: Apple Podcasts | Spotify | RSS
In the 39th session of Chandoo.org podcast, Let’s learn about FOR loops.
There is a special giveaway in this podcast. It is a workbook with several FOR loop VBA code examples. Listen to the episode for instructions.

What is in this session?
In this podcast,
- Announcements
- What is a loop – plain English & technical definitions
- For Loop vs. other kind of loops (While & Until)
- For Next loops
- For Each loops
- Nested For loops
- Special tips on For loops
- Performance issues & infinite loops
- Conclusions & giveaway

Here is a situation all too familiar.
You are looking at a spreadsheet full of data. You need to analyze and tell a story about it. You have little time. You don’t know where to start.
Today let me share 15 quick, simple & very powerful ways to analyze business data. Ready? Let’s get started.
Continue »CP036: How to do trend analysis using Excel?

Podcast: Play in new window | Download
Subscribe: Apple Podcasts | Spotify | RSS
In the 36th session of Chandoo.org podcast, Let’s follow the trend.
What is in this session?
In this podcast,
- A quick trip to down under
- What is trend analysis
- 4 types of common trends
- linear
- curve
- cyclical
- strange
- Doing trend analysis in Excel – the process
- How to use trend analysis results
- Conclusions
Narrating the story of change using Excel charts – case study

Here are three questions you often hear from your boss:
- What changes are happening in our business and how do they look?
- Do you know how to operate this new coffee machine?
- Why does every list has 3 items?
Jokes aside, our urge to find change in environment predates cave drawing, slice bread and Tommy Lee Jones. So, today let’s examine a very effective chart that tells the story of change and re-create it in Excel.
Continue »CP034: Advanced Excel Essentials book talk with Jordan Goldmeier
Podcast: Play in new window | Download
Subscribe: Apple Podcasts | Spotify | RSS
In the 34th session of Chandoo.org podcast, Let’s hear from Jordan Goldmeier – my friend, fellow blogger, Excel blogger & author. After many years of interaction thru email, blogs, Skype calls, finally I met him at PASS BA conference at Santa Clara this week. He gave me a copy of his new book – Advanced Excel Essentials and I immediately asked him to do a podcast. So here we go.

What is in this session?
In this podcast,
- Introduction
- What is this book all about
- Sample chapter review – User forms
- Design principles for creating advanced user interactions
- How to become advanced Excel user – pathway recommended by Jordan
- More info about Jordan
- A secret for you

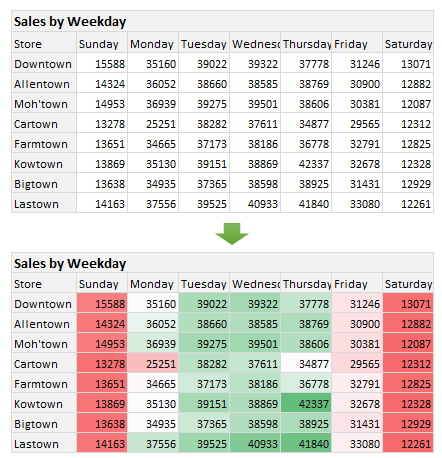
Learn two techniques to conditionally format the background of a chart based on some external value.
Continue »Check if 2 ranges have same values (set equality problem)

Hello folks,
Time for another homework problem. Assuming you have 2 ranges of values like below, how do you check if both of them have same set of values?
Continue »![How to consolidate data that is different shapes [BYOD]](https://chandoo.org/wp/wp-content/uploads/2015/02/consolidating-data-in-different-shapes-excel-problem.png)
Last week, I asked my email newsletter readers to submit “one data analysis problem you are struggling with”. We called it BYOD – Bring your own data. More than 100 people have emailed various interesting (and often very difficult) problems. This week (between 16th of February to 20th of February), let’s take a look at some of these problems and solve them.
Consolidating data in different shapes
We can use either VBA or Excel’s consolidation features to combine data that has same shape (ie same number & type of columns). Here is one way to do it.
But what if we need to consolidate data that is in different shapes?
Something like above.
In such cases, we can use 3 powerful tools.
- Multiple Consolidation Ranges – Pivot Tables
- VBA
- Power Query
So let’s examine how to use these approaches to consolidate data in different shapes.
Continue »What is the length of longest winning streak? [Excel homework]
![What is the length of longest winning streak? [Excel homework]](https://chandoo.org/wp/wp-content/uploads/2015/01/longest-winning-streak-problem.png)
Here is a fun problem to think about.
Let’s say you are looking at some data like above.
And you want to find out what is the longest streak of wins in the list.
How do you calculate it?
bonus question: What formula calculates when the longest streak began?
Continue »
Imagine you are the in-charge of finance department at Hogwarts. So one fine day, while you are practicing the spells, Dumbledore walks in to your office and says, “Our electricity bills are way too high. As the muggles don’t accept wizard money, we have to find a way to reduce our power consumption.”
So you summoned the previous 12 month utility bills to examine energy consumption patterns, and pretty soon you realized that most of the electricity consumption is due to the light bulbs. You suddenly have a brilliant idea. Why not replace the light bulbs with a variety that consumes low power? A light bulb moment indeed.
Your next step is to figure out what varieties of light bulbs are out there. Fortunately this is easier than catching a snitch in a game of quidditch. A quick search revealed that there are 3 types of light bulbs:
- Regular incandescent bulbs (the kind Hogwarts currently uses)
- Compact Fluorescent Light bulbs (CFL)
- Light Emitting Diode bulbs (LED)
Now your job is to do a cost benefit analysis of these options and pick one.
Continue »How to check for hard-coded values in Excel formulas?

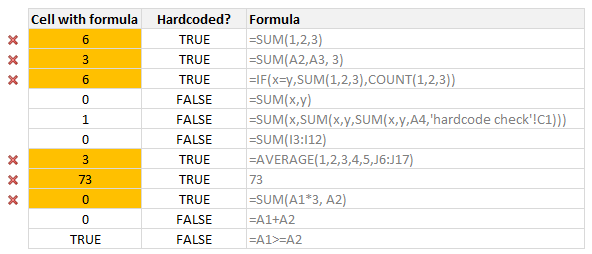
Here is a common problem. Imagine you are looking a complex spreadsheet, aptly titled “Corporate Strategy 2020.xlsx” which as 17 tabs, umpteen formulas and unclean structure. Whoever designed it was in insane hurry. The workbook has formulas like this, =SUM(Budget!A2:A30, 3600)+7925 .
It was as if Homer Simpson created it while Peter Griffin oversaw the project.
So how do you go about detecting all cells containing formulas with hard-coded values?
Continue »Compare 2 sets of data by letter or word & highlight mismatches [vba]
![Compare 2 sets of data by letter or word & highlight mismatches [vba]](https://img.chandoo.org/vba/compare-2-texts-by-letter-word-demo.gif)
We analysts like to compare. If you ever want to keep an analyst busy, just give her 2-3 options. She won’t return to your desk until the cows come home. My wife uses this trick all the time. Picture this:
[In late 2013]
Me: I want to buy a new phone
She: Do you want Nexus 5 or Galaxy S5 or iPhone 5s?
Its late 2014 and I am not done comparing.
So today, let’s talk about an interesting comparison scenario.
Comparing by letter or word
See above demo to understand the concept. Read more to learn how to do this.
Continue »Excel to the Next Level by Mastering Multiple Occurrences

This is a guest post by Sohail Anwar.
August 29, 1994. A day that changed my life forever. Football World Cup? Russia and China de-targeting nuclear weapons against each other? Anniversary of the Woodstock festival?
No, much bigger: Two Undertakers show up at WWE Summerslam for an epic battle. Needless to say: MIND() = BLOWN().
And thus begun one boy’s journey into understanding the phenomenon of Multiple Occurrences.
My journey continued, when just a few years later my grandfather handed me down a precious family heirloom: A few columns of meaningless data that I could take away and analyze in Excel. You may laugh but in the 90’s, every boy only wanted two things 1) Lists of pointless data and …
Continue »Looking up when data won’t play nice – few more alternatives

Recently, we discussed about the case of unwieldy data and how we lookup what we want using formulas like SUMIFS. Today, let us learn few more ways to solve the same problem.
Suitable structure spawns simple solutions
Poorly structured is the 2nd biggest problem of analysts. The first one is not enough coffee. That is why there is a dictum in the data analytics world.
Structure is everything
So, we can easily solve our lookup problem, if our data were to magically re-arranged in 2 column fashion – Data & Value.
Continue »

