It has been a really long time since we have an excel links post here. That doesnt mean I am not reading anything exciting. It is just that I have gotten busy being a dad. But now that I am in to a saner schedule, we are bringing back the excel links. Here is a […]
Continue »![Lets Pimp a Gauge Chart [Chart Porn Friday]](https://chandoo.org/wp/wp-content/uploads/2009/11/fancy-excel-gauge-chart-th.png)
Egil, one of our alert readers from Norway sent this to me in e-mail, which I swear, I am not making up – A Fancy Gauge Chart. See the e-mail and chart yourself. I’m having a lot of fun with your gauge template 🙂 To make it more industrial-like, I’ve added: 1. Brushed metal background […]
Continue »
Anyone working on the data using excel will know the importance of lookup formulas. They are vital for making almost any spreadsheet or dashboard. That is why when my friend John Franco, who maintains Excel-Spreadsheet-Authors.com, wrote to me about his new book Excel lookup toolbox I was truly excited. In this post I am going to share my review of this product.
Continue »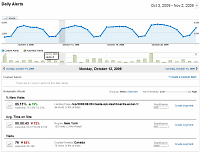
Yesterday while checking my website analytics reports on Google analytics site, I have noticed a new beta feature called “Intelligence”. Out of curiosity I clicked on it. It took me to a an intelligence alert dashboard. Ok, lets just back up for a minute and understand what “intelligence dashboard” is before moving on. In the […]
Continue »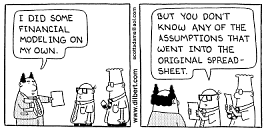
We all have atleast one story of how that one time the boss / co-worker / classmate / cat ruined the carefully crafted excel spreadsheet by mucking up the formulas or disturbing the formatting. Read this post to learn 10 awesome excel tips to make better and boss-proof excel sheets.
Continue »![Switch Rows and Columns in Charts [Quick Charting Tip]](https://chandoo.org/img/c/switch-rows-columns-in-charts.png)
Let us say you have built a nice chart showing your sales and profits for the top 5 products (learn how to highlight top 5 products in a list), with products on X axis. Suddenly your boss wants to switch the rows to columns (or transpose the chart) so that she can see metric level grouping instead of product level grouping. No need to freak out and rush to Espresso machine, You can do it very easily with Excel Charting features.
In today’s quick tip you will learn how to swap chart rows and columns in excel.
Continue »They say on once in a while even monkey’s thump their chests and show off. As a proud evolver, I must take their lead and thump my chest. I want to share a sweet testimonial I received from Marcea, one of our newest readers. Read more to see the testimonial.
Continue »
