A better chart to visualize “Best places to live” – Top 100 cities comparison Excel chart
Recently, I saw this chart on Economist website.
It is trying to depict how various cities rank on livability index and how they compare to previous ranking (2014 vs 2009).
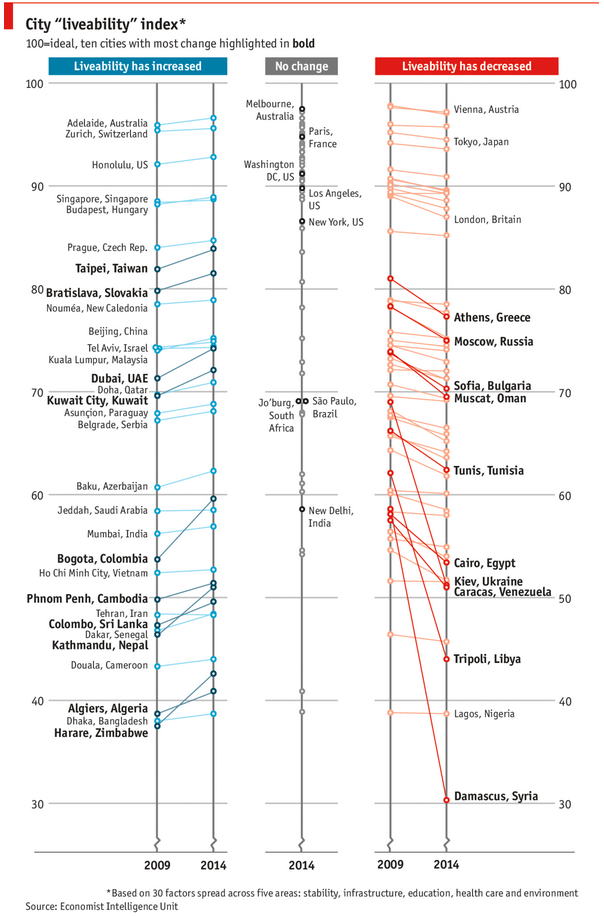
As you can see, this chart is not the best way to visualize “Best places to live”.
Few reasons why,
- The segregated views (blue, gray & red) make it hard to look for a specific city or region
- The zig-zag lines look good, but incredibly hard to understand % changes (or absolute changes)
- Labels are all over the place, thus making data interpretation hard.
- Some points have no labels (or ambiguous labels) leading to further confusion.
After examining the chart long & hard, I got thinking.
Its no fun criticizing someones work. Creating a better chart from this data, now thats awesome.
ABC Inventory Analysis using Excel
ABC analysis is a popular technique to understand and categorize inventories. Imagine you are handling inventory at a plant that manufactures high-end super expensive cars. Each car requires several parts (4,693 to be exact) to assemble. Some of these parts are very costly (say few thousand dollars per part), while others are cheap (50 cents per part). So how do you make sure that your inventory tracking efforts are optimized so that you waste less time on 50 cent parts & spend more time on costly ones?
This is where ABC analysis helps.
We group the parts in to 3 classes.
- Class A: High cost items. Very tight control & tracking.
- Class B: Medium cost items. Tight control & moderate tracking.
- Class C: Low cost items. No or little control & tracking.
Given a list of items (part numbers, unit costs & number of units needed for assembly), how do we automatically figure which class each item belongs to?
And how do we generate above ABC analysis chart from it?
Mapping relationships between people using interactive network chart
Today, lets learn how to create an interesting chart. This, called as network chart helps us visualize relationships between various people.
Demo of interactive network chart in Excel
First take a look at what we are trying to build.
Looks interesting? Then read on to learn how to create this.
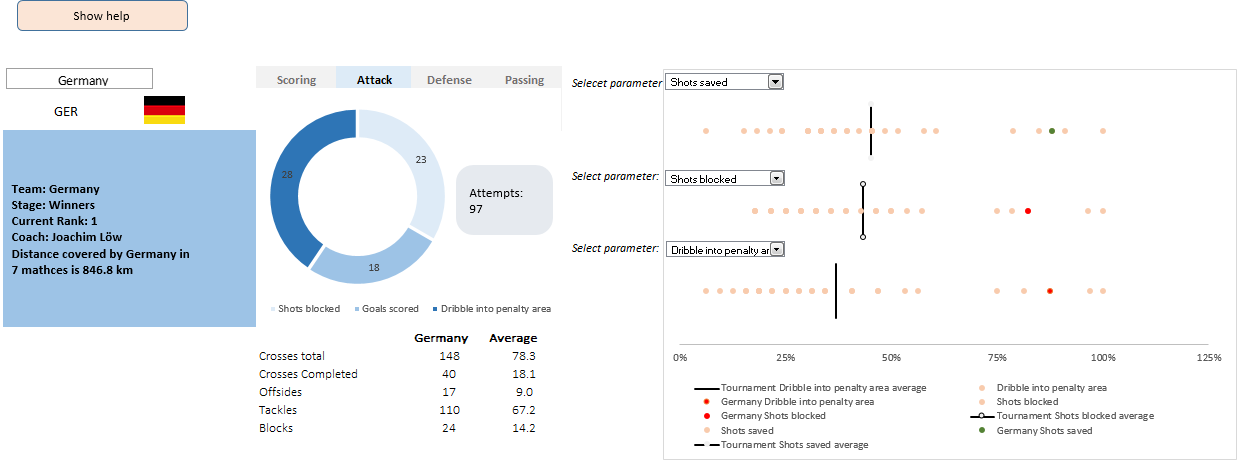
A dashboard to visualize this FIFA worldcup [guest post]
This is a guest post by Krishna, a football lover & one of our readers.
The wait for lifting the most valued priced in football for Germans was finally over. For a football fan, world cup is best time that is scheduled every four years and that if your favorite team lifting the trophy is like your crush is going on a date with you. 🙂
A sneak-peek at the final dashboard
Here is the final dashboard (it has more functionality than depicted). Click on it to enlarge.
Story of my first ever 200KM bike ride (plus an Excel dashboard with ride stats)

Ok people. Let me tell you that this post is almost not about Excel. It is about how one Excel blogger’s (yours truly) dream of long distance cycling came true. So sit back, grab your favorite drink and read between sips.
So what is this all about?
Last Sunday (27th July) & Monday (28th), I finished my first ever 200KM bicycle ride. I rode for a little more than 12 hours, burned 5,179 calories & rode 206 kilometers.
It is definitely one of the most memorable, tiresome & uplifting experiences in my life. So naturally, I want to share the story with you.
How fireworks animated chart is made [video tutorial]
On July 4th this year, I published an animated fireworks chart for you. Many of you liked it. Quite a few wanted to know how its made.
So here is a video explaining the construction of fireworks.
(You can see this video on our YouTube Channel too)
CP014: How to create awesome dashboards – 10 step process for you
Podcast: Play in new window | Download
Subscribe: Apple Podcasts | Spotify | RSS
In the 14th session of Chandoo.org podcast, lets figure out how to make awesome dashboards.
What is in this session?
Excel based dashboards are much in demand these days, thanks to advancements in Excel & growing pressure on costs. Now a days, analysts & managers are expected to quickly put together a dashboard using Excel. But how do you make a dashboard? What process you should follow? These are the questions we address in this podcast.
In this podcast, you will learn,
- Announcements about upcoming dashboard classes
- Ten step process for creating awesome dashboards
- 1. Talk to your end users
- 2. Make a sketch of the dashboard
- 3. Validate your understanding
- 4. Collect data
- 5. Structure the data
- …