All articles in 'Excel Howtos' Category
{ 17 Comments }
Figure out slot from given time [quick tip]
Published on Apr 19, 2016 in Excel Howtos, Quick Tip
![Figure out slot from given time [quick tip]](https://chandoo.org/wp/wp-content/uploads/2016/04/timeslot-from-time-excel-formulas.png)
Here is an interesting scenario.
Let’s say you are looking at a time, like 9:42 AM and want to know which 15 minute slot it fits into. The answer is 9:30 – 9:45. But how would you get this answer thru Excel formulas?
Continue »{ 29 Comments }
These icons are so pretty, can I get them in green? [conditional formatting trick]
Published on Mar 22, 2016 in Excel Howtos, Learn Excel
One of our readers emailed this question recently,
I like the conditional formatting icons. I am trying to present some business data where going down is good. How do I get a green colored down arrow icon?
Essentially, Ms. CanIGetItInGreen wants this:
Unfortunately, Excel’s conditional formatting icons are not customizable. So we can’t get the green down arrows without some sneak. And sneak we shall.
Continue »
Lets look at how to apportion sales according to multiple criteria
Continue »![Not so wild lookups [video]](https://chandoo.org/wp/wp-content/uploads/2016/02/not-so-wild-lookups.png)
In case, this is the first time you are hearing about Excel formula wildcards, check out the Using wildcards in Excel VLOOKUP formula tutorial.
So you know about wild cards like * ?, now how would you tell VLOOKUP to ignore them?
Say, you are genuinely interested in looking the value “* Payroll” in a lookup table. What then?
This is exactly the problem faced by Peter in our forum post VLOOKUP and cells with “*” NOT to be interpreted as wildcard
Continue »
Here is an interesting twist on the good old VLOOKUP. How to find the pricing applicable for given quantity of a product?
Something like above.
Looks interesting? Then read on…
Continue »![Edit cells & formulas faster [shortcut]](https://chandoo.org/wp/wp-content/uploads/2015/11/shortcuts-for-editing-quickly.png)
Let’s keep this simple & short.
Whenever you are editing cells or formulas, the usual sequence is like this:
- Double click on the cell you want to edit
- For existing cells: Go to the left most / right most part and start typing
- For blank cells: start typing right away
Here is a faster sequence:
Read on…
Continue »{ 11 Comments }
Use NUMBERVALUE() to convert European Number format
Published on Oct 6, 2015 in Excel Howtos, Learn Excel
If you deal with customers or colleagues in Europe, often you may see numbers like this:
- 1.433.502,50
- 9.324,00
- 3,141593
When these numbers are pasted in Excel, they become text, because Excel can’t understand them.
Here is a simple way to convert the European numbers to regular ones.
Use NUMBERVALUE() Function.
Continue »{ 2 Comments }
Weighted Sorting in Excel [video]
Published on Oct 1, 2015 in Excel Howtos, Learn Excel
![Weighted Sorting in Excel [video]](https://chandoo.org/wp/wp-content/uploads/2015/10/weighted-sort-in-excel.png)
Imagine you are looking customer data like below and want to sort them by performance. If you sort the data by any one column, you will not get full picture of performance. To understand which customers rank low on performance, you need to defined a weighed sort, the kind of sort where you assign weights to each attribute (customer age, recent purchases and rate of returns) and come up with single score to sort them all.
Sounds interesting? Watch below video to understand how to do weighted sorting in Excel.
Continue »
We all know that VLOOKUP (and its cousins MATCH, HLOOKUP and LOOKUP) are great for finding information you want. But they are helpless when you want to do a case-sensitive lookup.
So how do we write case sensitive VLOOKUP formulas?
Simple. We can use EXACT formula.
Continue »{ 9 Comments }
How to create cascading drop downs in Excel – video
Published on Aug 31, 2015 in Excel Howtos, Learn Excel

Cascading drop downs enhance usability of your dashboards & interactive workbooks. A cascading drop-down is a 2 or more level selection mechanism. When you have 100s of selection choices, instead of creating one massive drop down or combo-box, you can set up multiple levels of drop downs, so that users can narrow down their selection. For example, users can select Country, State and then City using cascading drop downs.
There are many ways to setup cascading drop downs. You can use formulas coupled with either data validation or form controls. You can also use Slicers. In this video we will review these techniques.
Continue »
Yesterday, you learned about Print Areas – a time & paper saving feature of Excel. While print areas are great, you can only set up one print area per sheet. What if you want to print either report or data based on user selection?
In such cases, you can set up dynamic print areas.
That is right. See above demo to understand how it looks. Read on to learn how to set up dynamic print areas.
Continue »{ 5 Comments }
Save time & paper with print areas in Excel
Published on Aug 23, 2015 in Excel Howtos
Here is a very simple but effective tip: use print areas. Oh.. but what is a print area? Imagine looking at a report or dashboard worksheet. Now, that sheet also has few calculations, some extra stuff to the right of the report. When you print, you don’t need those extra elements. Just the report will do. This […]
Continue »{ 11 Comments }
Reconcile debits & credits using Solver [Advanced Excel]
Published on Aug 18, 2015 in Analytics, Excel Howtos
![Reconcile debits & credits using Solver [Advanced Excel]](https://chandoo.org/wp/wp-content/uploads/2015/08/match-debits-credits-solver-parameters.png)
Here is a tricky problem often faced by accountants and finance professionals: Let’s say you have 5 customers. Each of them need to pay you some money. Instead of paying the total amount in one go, they paid you in 30 small transactions. The total amount of these transactions matches how much they need to pay you. But you don’t know which customer paid which amounts. How would you reconcile the books?
If you match the transactions manually, it can take an eternity – after all there are more than 931 zillion combinations (5^30).
This is where solver can be handy. Solver can find optimal solution for problems like this before you finish your first cup of coffee.
Continue »{ 16 Comments }
Use mail merge to create custom letters, invoices, labels and more
Published on Aug 17, 2015 in Excel Howtos

The idea of mail merge is simple & powerful. Imagine you handle recruitment at a large company. You just hired 300 analysts for the big data division. The next job – generate employment offer letters for each of them. Of course, you don’t want to type these letters one at a time. You have the details of all the 300 offers (name, email, address, offer code, role, benefit package details and date of joining etc.) in a spreadsheet. You also have a template of the offer letter.
Enter mail merge. This powerful feature of MS Word combines (Excel) data with Word document contents to generate all the 300 letters in just few minutes.
Continue »{ 11 Comments }
In-cell 5 star chart – tutorial & template
Published on Aug 15, 2015 in Charts and Graphs, Excel Howtos
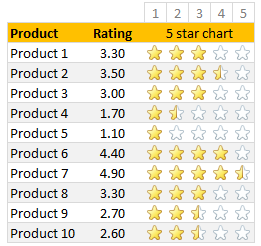
Whenever we talk about product ratings & customer satisfaction, 5 star ratings come to our mind. Today, let’s learn how to create a simple & elegant 5 star in-cell chart in Excel. Something like above.
Read on to learn how to create the above chart.
Continue »
