All articles in 'Featured' Category
VLOOKUP(), MATCH() and INDEX() – explained in plain English

VLOOKUP may not make you tall, rich and famous, but learning it can certainly give you wings. It makes you to connect two different tabular lists and saves a ton of time. In my opinion understanding VLOOKUP, INDEX and MATCH worksheet formulas can transform you from normal excel user to a data processing beast. Today, […]
Continue »
Excel pivot tables are very useful and powerful feature of MS Excel. They are used to summarize, analyze, explore and present your data. In plain English, it means, you can take the sales data with columns like salesman, region and product-wise revenues and use pivot tables to quickly find out how products are performing in each region.
In this tutorial, we will learn what is a pivot table and how to make a pivot table using excel.
Continue »
Excel table is a series of rows and columns with related data that is managed independently. Excel tables, (known as lists in excel 2003) is a very powerful and supercool feature that you must learn if your work involves handling tables of data.
What is an excel table?
Table is your way of telling excel, “look, all this data from A1 to E25 is related. The row 1 has table headers. Right now we just have 24 rows of data. But I can add more later!”
Continue »Are you a Solver Virgin? Watch this tutorial video …,
Do you ever think about questions like this?
1) What is the maximum profit we can make?
2) What is the best way to schedule employees in shifts?
3) What the best combination of tasks we can finish in a given time?
You might have heard about Excel Solver tool while trying to find solutions to questions above. If you have never used Solver or have little idea about it, then this post and video are for you.
Continue »Show Zebra Lines when Value Changes [Excel Conditional Formatting Homework]
![Show Zebra Lines when Value Changes [Excel Conditional Formatting Homework]](https://chandoo.org/img/hw/zebra-lines-when-value-changes-excel-conditional-formatting.png)
Here is a quick home work on excel conditional formatting. Lets say you have data as shown below to left and you need to show zebra lines whenever the value changes (see right). Your home work is simple. Just figure out how to write conditional formatting rules to add zebra lines. The data set is […]
Continue »How to cook a delicious dynamic chart that will have your boss drool

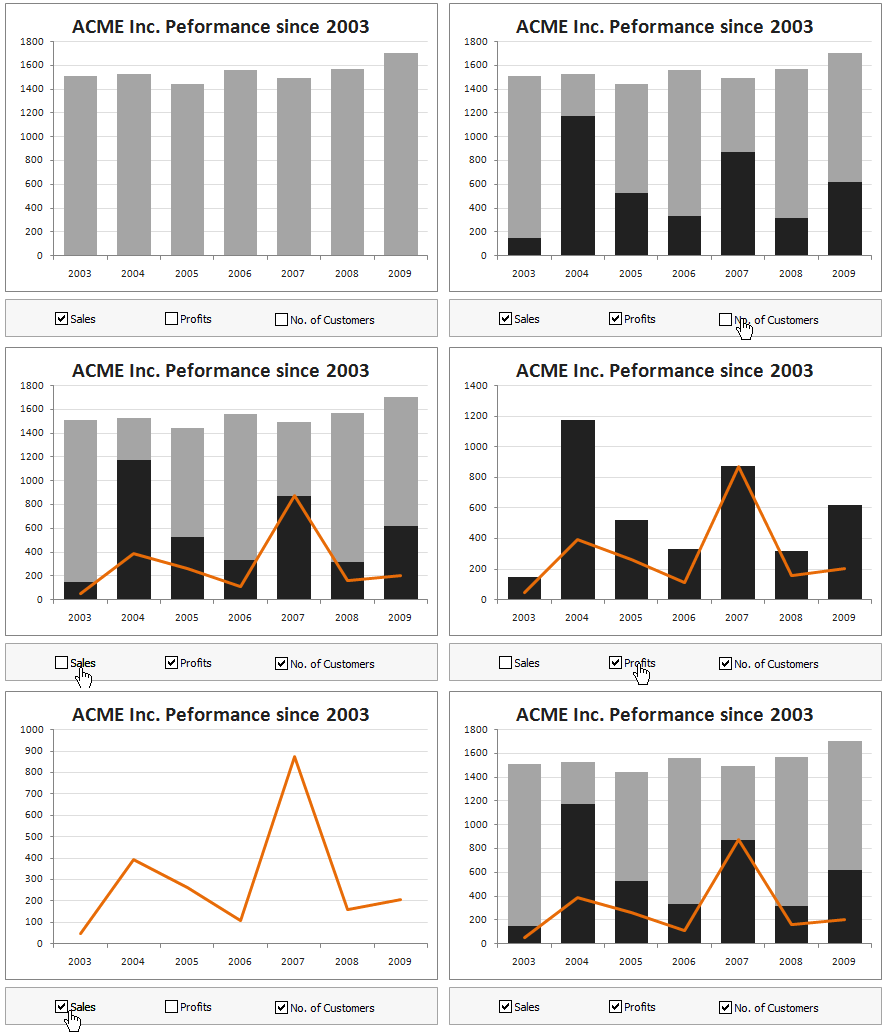
Dynamic charts are like my favorite food, Mangoes. They tempt, tease and taste awesomely. In this post, we are going to learn how to create a dynamic chart using check boxes and formulas as shown in the animation aside. Are you ready for some excel chart cooking?
You can also download a FREE Dynamic chart template from the post. So go ahead and make your boss drool.
Continue »How do you make charts when you have lots of small values but few extremely large values? [Debate]
![How do you make charts when you have lots of small values but few extremely large values? [Debate]](https://img.chandoo.org/c/charts-with-small-large-values-th.png)
Here is an interesting charting problem we come across once in a while. We have a lot of small numbers and a few very large numbers. How do we effectively plot all of them in a chart?
Now, how do you go about making a chart?
Continue »What is the most unusual thing you have used Excel for? [Quick Poll]
![What is the most unusual thing you have used Excel for? [Quick Poll]](https://chandoo.org/img/polls/unusual-uses-of-excel.png)
Ok. This is quick and short. What is the most weird, unusual, out of the world thing you have used excel for?
I have used excel to generate and clean a list of tags for this blog, to keep track of which movies I have seen in the IMDb Top 250 list, to simulate monopoly board game, just so I can play it better than my wife 😉 etc.
What about you? Share using comments.
Continue »How Francis Landed on Chandoo.org, Become Awesome and Made a Superb Dashboard, all in ONE Weekend
As part of our Reader Awesomeness Week, Francis shares with us a travel site dashboard he made for his company. Francis took just two days to prepare this awesome dashboard which uses concepts like bullet charts, sortable KPI grid, Date based filtering, dynamic charts and more. I was really moved by Francis’ gesture in sharing his work with us, so much that, I did a video review of his work. You can see it in the embedded youtube video to the left.
Read the rest of the article to know how this dashboard is made and get a copy of the file.
Continue »![Introduction to Financial Modeling using Excel [Part 1 of 6]](https://chandoo.org/img/fm/financial-modeling-excel.png)
In this and next 5 posts, we are going to learn how to build a financial model to do project evaluation using Excel. The 6 parts of this tutorial are,
- Introduction to Financial Modeling
- Building a layout for Project Evaluation Model – Best practices
- Building Inputs and Assumptions Sheet
- Building Projections for Project Evaluation
- Modeling the Cash Flow Statement and Projections
- Putting it all together – Final Project Evaluation Model
What is financial modeling?
Financial modeling is creating a complete program/ structure, which helps you in coming to a decision regarding investment in a project/ company. Now this could be on a simple piece of paper or in excel. The advantage with excel is that, even if you have calculation speed and accuracy like me (this is one place where I am like Einstien!), then also you would be able to come to the right conclusion!
Continue »Find-out Days Overlaped [Excel Formula Homework]
![Find-out Days Overlaped [Excel Formula Homework]](https://chandoo.org/img/f/date-overlap-conditions.png)
Few days back we have learned how to find if 2 sets of dates overlap using Excel Formulas. For eg. we have learned that to check whether {1 July,2010 to 23 July 2010} overlaps with the date range {15 July, 2010 to 16 August 2010}, we can use a formula like, =if(or(and(x>=a,x<=b),and(a>=x,a<=y)), “Overlap”,”Do not overlap”) […]
Continue »
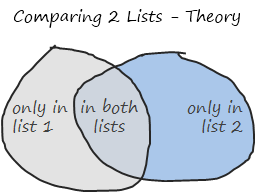
Comparison of lists of data is something that we do all the time. Today, lets learn a few tricks that you can apply immediately to compare 2 lists using Excel. This post discusses how to compare two lists with formula based rules. If you just want to quickly highlight common values, click here. If you […]
Continue »Average of Top 5 Values [and some homework]
![Average of Top 5 Values [and some homework]](https://chandoo.org/img/f/average-of-top5-values-excel-formula.png)
The other day, while doing consulting for one of my customers, I had a strange problem. My customer has data for several KPIs and she wants to display average of top 5 values in the dashboard. Now, if she wants average of all values, we can use AVERAGE() formula if she wants top 5 values […]
Continue »What is new in Microsoft Excel 2010? [Office 2010 Week]
![What is new in Microsoft Excel 2010? [Office 2010 Week]](https://chandoo.org/img/2010/excel-2010-whats-new.png)
Office 2010, the latest and greatest version of Microsoft Office Productivity applications is going to be available worldwide in the next few weeks. I have been using Office 2010 beta since November last year and recently upgraded my installation to the RTM version. I was pleasantly surprised when I ran Microsoft Excel 2010 for first time. It felt smooth, fast, responsive and looked great on my comp.
This week, I want to celebrate the launch of Excel 2010 and write about the following new features in Excel 2010.
Also, you can win a copy of Office 2010 – home & student edition by leaving a comment on this or any of the other excel 2010 posts scheduled for this week
Continue »Introduction to Panel Charts using Excel – Tutorial & Template

In this article we will learn what a Panel Chart is and how you can construct a panel chart in Excel.
What is a Panel Chart?
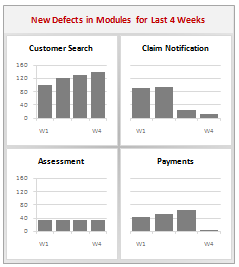
A panel chart is a set of similar charts neatly aligned in panels to help us understand some data which has multiple variables in it. Panel charts are also called by names “trellis displays” or “small multiples”. They are an effective way to display multi-variable data.
Here is an example panel chart showing the total defects per module over the last 4 weeks.
Continue »

